Download in PDF (data tables included)
G20 merchandise trade showed mixed developments in Q4 2025 as measured in current US dollars, with exports increasing by 0.9% and imports declining by 0.5% compared with Q3 2025. Preliminary estimates indicate that G20 trade in services1 expanded modestly in Q4 2025, with exports and imports rising by 1.4% and 1.2%, respectively (Figures 1 and 3). For 2025 as a whole, G20 trade in goods increased, with exports rising by 5.3% and imports by 1.2% and estimates suggest that G20 services trade continued to expand in 2025, with both exports and imports increasing by 8.2%.
Merchandise trade developments varied across G20 economies in Q4 2025. In North America, exports increased in both the United States (3.1%) and Canada (2.5%), largely driven by shipments of non-monetary gold and other precious metals, while imports declined slightly in both countries. Mexico recorded strong growth in exports (6.1%) and imports (5.4%), mainly reflecting trade in mechanical appliances and electrical machinery. Elsewhere in the Americas, Argentina’s exports rose by 4.6%, driven mainly by higher sales of petroleum oils and agricultural products, while imports declined by 1.2%. Brazil’s exports increased by 6.5%, supported by sales of coffee and ores, whereas imports fell by 5.6%, partly due to lower purchases of ships and fertilisers. In the European Union, exports and imports declined by 0.4% and 1.2% respectively. Germany recorded small movements in exports and imports while France’s exports rose by 2.0%, notably in mechanical, electrical and ICT equipment, and its imports fell by 2.3% partly due to lower purchases of pharmaceuticals and energy. In the United Kingdom, exports decreased by 1.3% and imports by 3.0%, reflecting lower imports of oil, transport equipment and pharmaceuticals. In East Asia, China’s exports were up 0.7% while imports were down 1.7%. Japan recorded stable exports (0.3%) and a decline in imports (-2.5%). Korea’s exports rose by 1.2%, driven by semiconductors, while imports declined mainly due to lower energy prices.
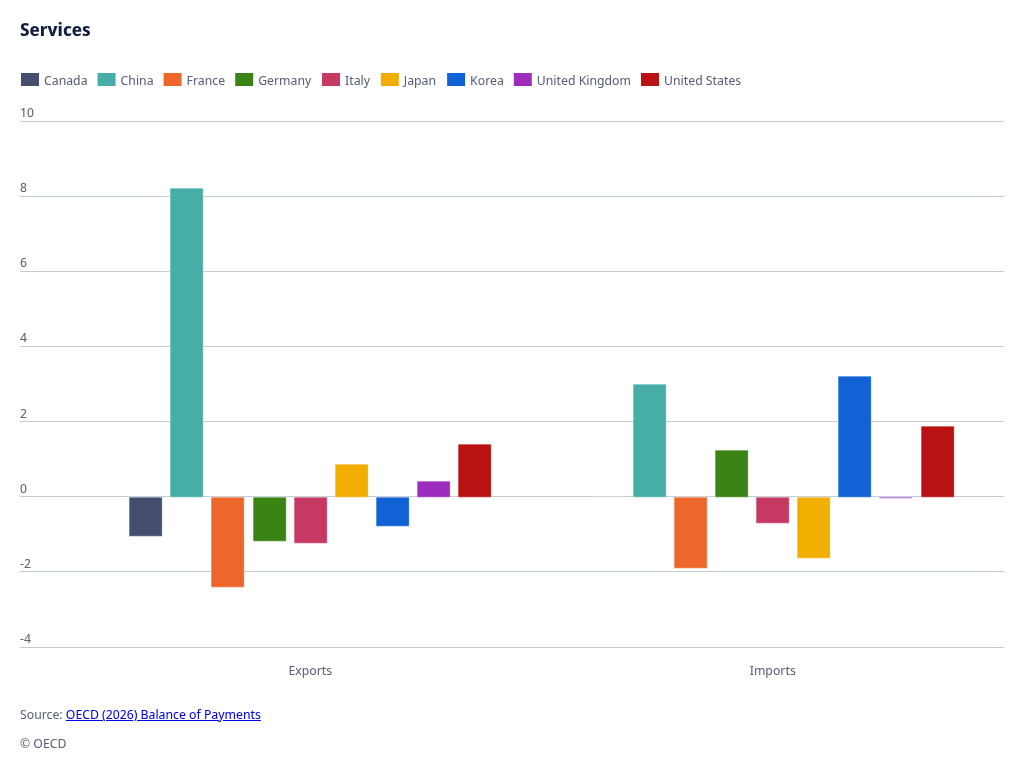
International trade in services expanded modestly in Q4 2025. Among G7 economies, services exports rose modestly in the United States (1.4%), driven by intellectual property products, ICT and other business services, while imports increased by 1.9%, due to higher expenditures in travel and other business services. In Canada, exports fell by 1.0% due to lower receipts from travel and other business services, while imports recorded zero growth. Germany posted a 1.2% decline in services exports and a 1.2% rise in imports, the latter largely reflecting higher travel payments abroad. French exports and imports decreased by 2.4% and 1.9%, respectively. Japan’s services exports rose by 0.9%, supported by higher revenues from other business services, while imports declined by 1.6%, driven by lower payments for transport, travel and other business services. Conversely, Korea’s exports fell by 0.8% as weaker travel receipts offset higher transport revenues, while imports rose by 3.2% on the back of higher transport and travel payments. China recorded strong growth in exports (8.2%) and to a lesser extent imports (3.0%), with travel and ICT services underpinning the export performance. Brazil posted a strong rise in exports (9.5%) and a 1.0% decline in imports, while India recorded sharp growth in both exports and imports.
Figure 1 – International trade, selected economies, Q4 2025 (quarter-on-quarter changes)
Percentage change, current US dollars, seasonally adjusted
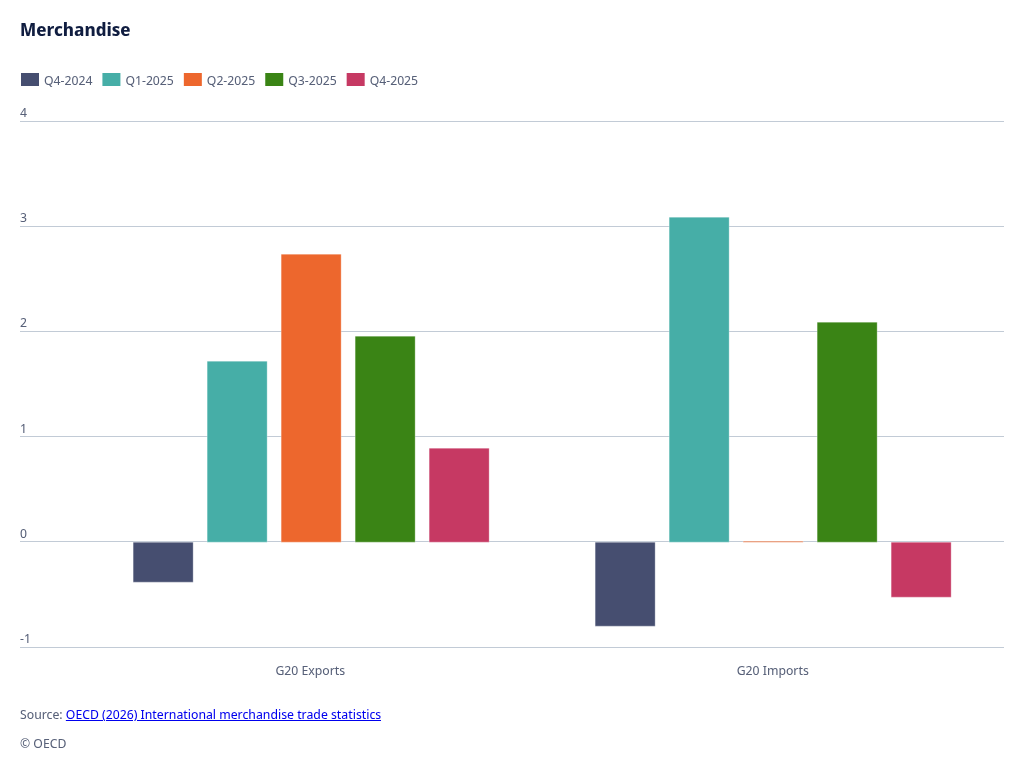
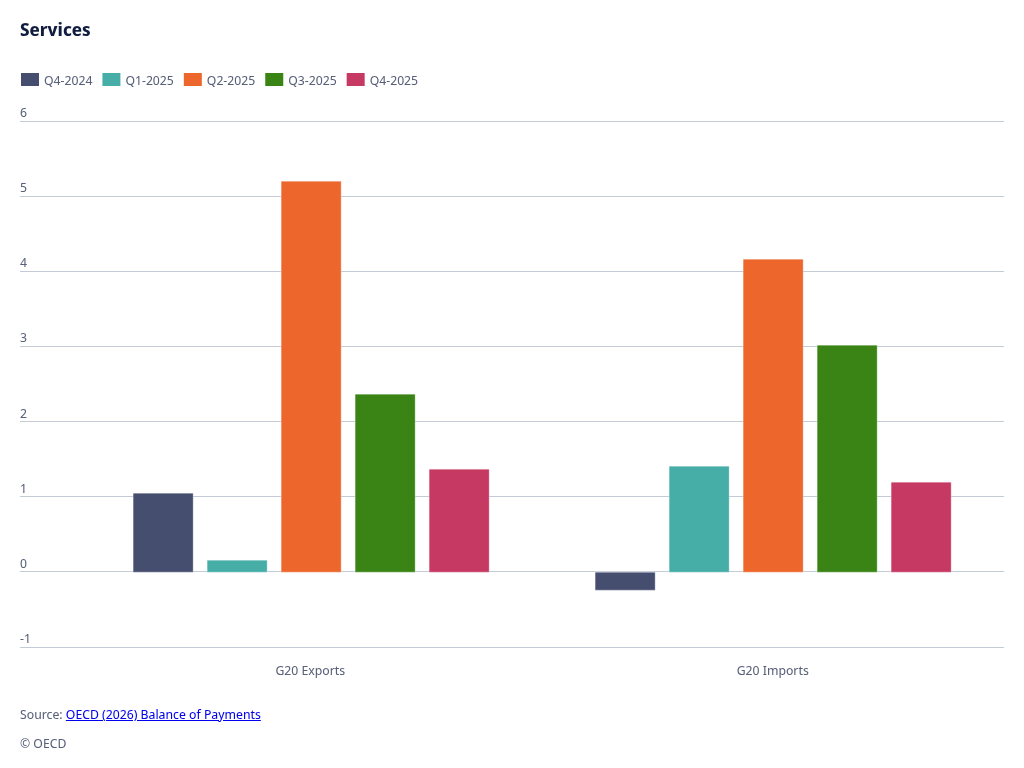 Figure 2 – International trade, selected economies, Q4 2025 (quarter-on-quarter changes
Percentage change, current US dollars, seasonally adjusted
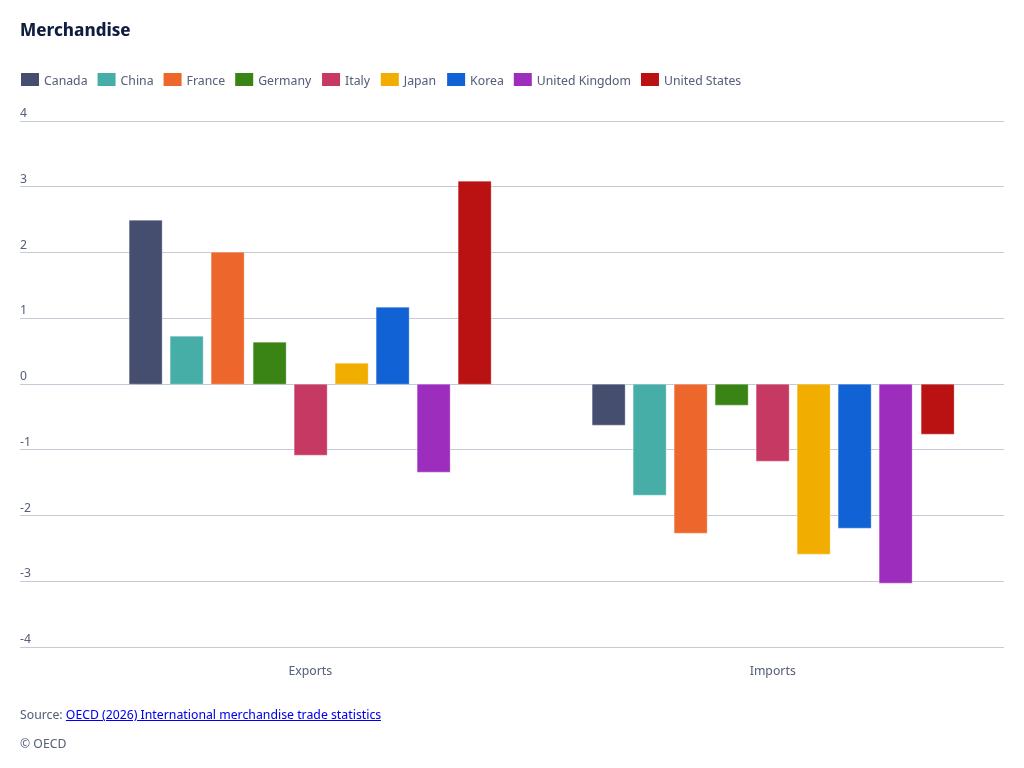
Note: Values for the following economies are OECD preliminary estimates based on monthly national data: Canada, China, France, Germany, Italy, the United Kingdom and the United States.
Figure 3 – G20 international trade (quarterly levels)
Current prices in billion US dollars, seasonally adjusted
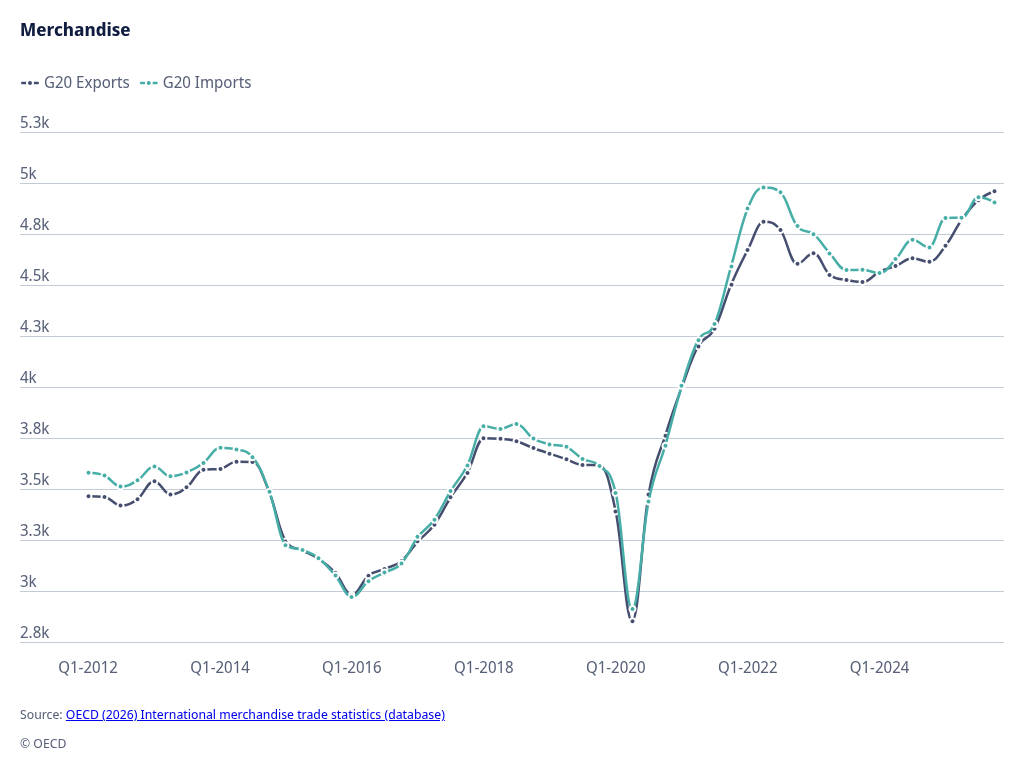
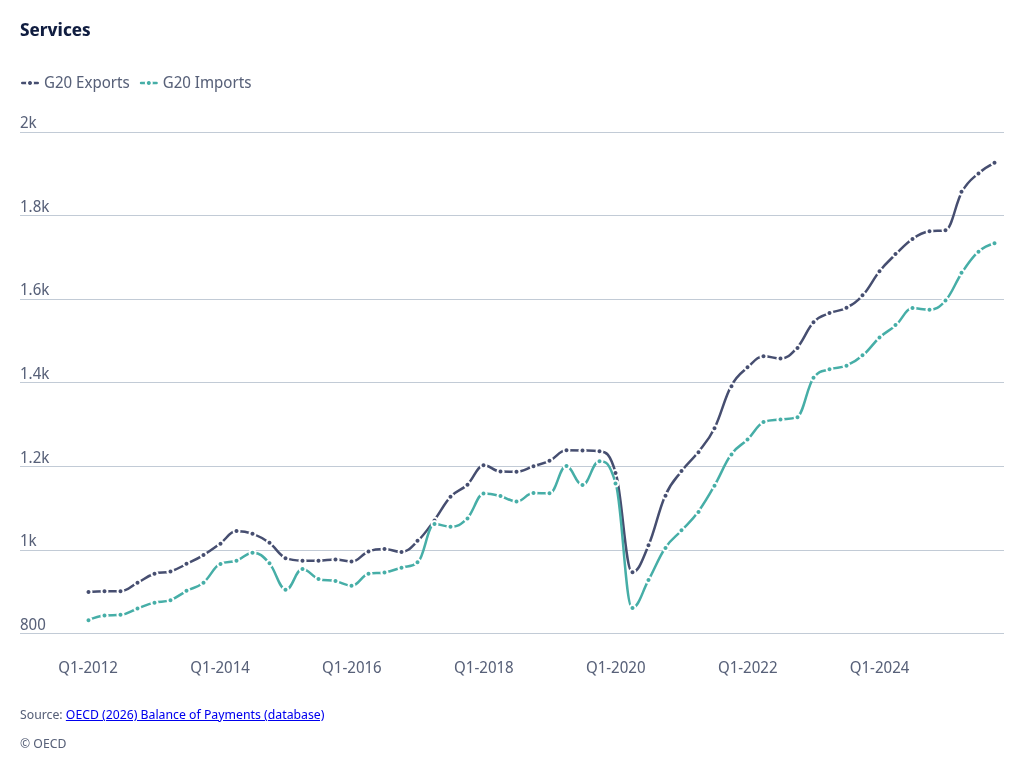
Note: The Q4 2025 trade in services values are preliminary estimates based on available data, covering at least 60% of exports and imports. The G20 aggregates do not include African Union countries, except for South Africa. The Russian Federation is included in the G20 estimates.
Figure 4 – Main contributors to quarter-on-quarter G20 growth, 2025 Q4
Percentage change, current US dollars, seasonally adjusted
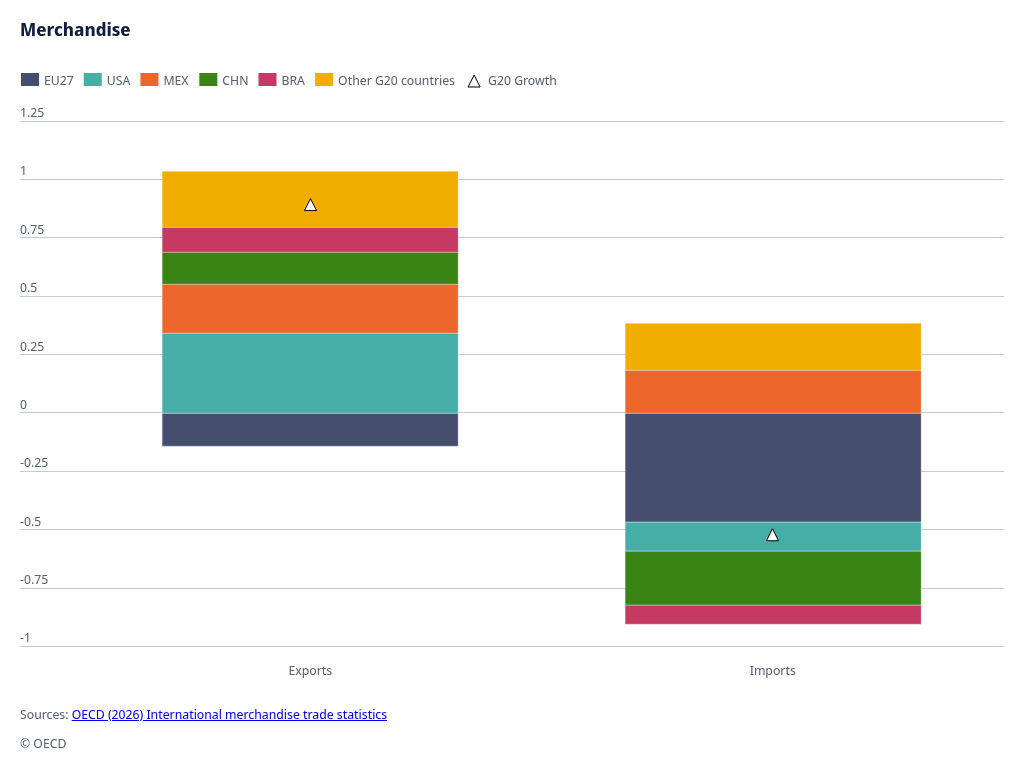
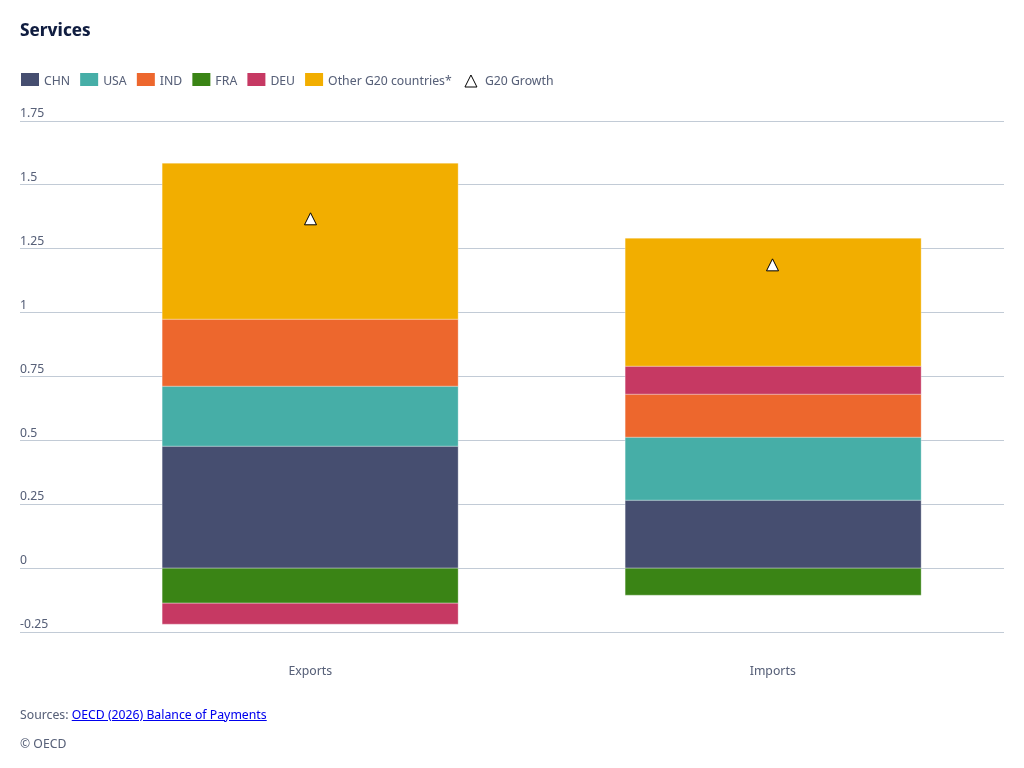
Note: The Q4 2025 trade in services values are preliminary estimates based on available data, covering at least 60% of exports and imports for the G20 aggregate which does not include African Union countries, except for South Africa. The Russian Federation is included in the G20 estimates.
Note:
The Q4 2025 trade in services values are preliminary estimates based on available data, covering at least 60% of exports and imports for the G20 aggregate which does not include African Union countries, except for South Africa. The Russian Federation is included in the G20 estimates.
Methodology
Release dates
Next release: 26 May 2026
For further information, journalists are invited to contact the OECD's Media Relations Division on (33) 1 45 24 97 00; others should contact the Statistics and Data Directorate.