1 Overview
Trade tariffs and related uncertainty contributed to strong fluctuations in economic activity during the first half of 2025, with frontloading of activity, especially in Ireland. The unwinding of these factors in the second half of the year is expected to entail further volatility, blurring signals of the underlying momentum of the euro area economy. In fact, looking through the volatility caused by the fluctuations in Irish data, economic growth in the rest of the euro area was more stable, and it is expected to remain so in the second half of the year. Although the new US-EU trade agreement implies higher tariffs on euro area exports to the United States, it has helped to reduce trade policy uncertainty. Later in the horizon economic growth in the euro area is projected to strengthen, supported by several factors. Rising real wages and employment, together with new government spending on infrastructure and defence, mainly in Germany, should bolster euro area domestic demand. Furthermore, less restrictive financing conditions – mainly reflecting recent monetary policy decisions – and a rebound in foreign demand in 2027 are also seen to support the growth outlook. Annual average real GDP growth is projected to be 1.2% in 2025, 1.0% in 2026 and 1.3% in 2027. Compared with the June 2025 Eurosystem staff macroeconomic projections, the outlook for GDP growth has been revised up by 0.3 percentage points for 2025, reflecting better than expected incoming data and a carry-over effect from revisions to historical data. As not all of the data surprises relate to stronger than previously assumed frontloading of activity, they are only seen to be partly offset in the second half of the year. The appreciation of the euro and weaker foreign demand (in part related to somewhat higher tariffs than assumed in the June projections) have resulted in a 0.1 percentage point downward revision for 2026. The projection for 2027 remains unchanged.[1]
The inflation outlook is consistent with inflation stabilising around the medium-term target of 2%. Headline inflation, as measured by the Harmonised Index of Consumer Prices (HICP), is projected to move sideways, at around 2%, for the rest of 2025, and then to drop to 1.7% in 2026 before recovering to 1.9% in 2027. The drop in 2026 reflects a further gradual easing in the non-energy components, while energy inflation is expected to remain volatile, but to rise over the projection horizon, in part because of the start of the EU Emissions Trading System 2 (ETS2) in 2027. Food inflation is expected to remain elevated initially, as lagged effects from past price increases in international food commodities feed through, but to moderate to rates somewhat above 2% in 2026 and 2027. HICP inflation excluding energy and food (HICPX) is expected to decline as wage pressures recede and services inflation moderates, and as the appreciation of the euro feeds through the pricing chain and curbs goods inflation. Lower wage growth, as past real wage losses have been recouped, coupled with a recovery in productivity growth, is expected to lead to significantly slower unit labour cost growth. Compared with the June 2025 projections, the outlook for headline HICP inflation has been revised up by 0.1 percentage points for both 2025 and 2026 on account of higher energy commodity price outcomes and assumptions, as well as lagged effects from higher international food commodity prices, which more than offset the appreciation of the euro. For 2027, the lagged effects of the appreciation of the euro are seen to predominate, resulting in a 0.1 percentage point downward revision.
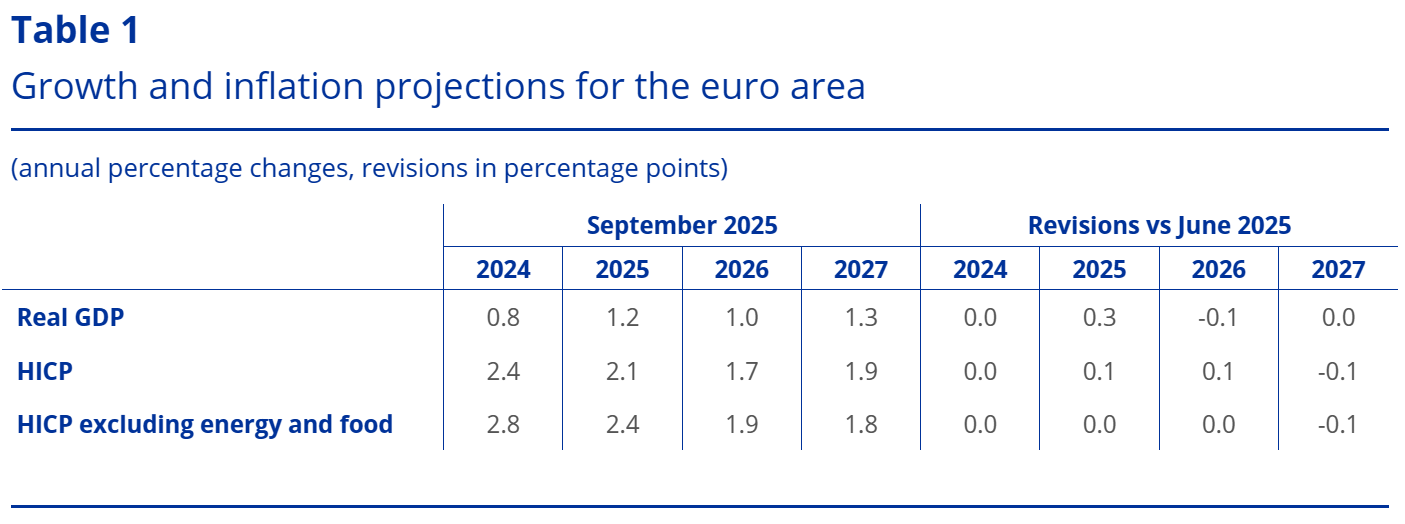
Notes: Real GDP figures refer to annual averages of seasonally and working day-adjusted data. Historical data may differ from the latest Eurostat publications owing to data releases after the cut-off date for the projections. Revisions are calculated from rounded figures. Data are available for downloading, also at quarterly frequency, from the Macroeconomic Projection Database on the ECB’s website.
2 The international environment
While US tariffs have continued to increase since the cut-off date for the June 2025 projections, the announcement of preliminary agreements on trade deals and the extension of the tariff truce between the United States and China have mitigated trade policy uncertainty, which nonetheless remains elevated. The baseline assumptions for tariffs and trade policy uncertainty are presented in more detail in Box 1. Section 232 investigations by the US Administration regarding sectoral tariffs for pharmaceuticals, semiconductors and lumber are still ongoing, thus posing an upside risk to the tariff assumptions.
The outlook for global growth is expected to weaken, although less sharply than envisaged in the June 2025 projections.[2] Global real GDP growth is projected to be 3.3% in 2025, down from 3.6% last year, and then to decrease further, to 3.1% in 2026, before recovering to 3.3% in 2027 (Table 2). Real GDP growth surprised on the upside in the second quarter in major economies (including the United States, China and the United Kingdom), but recent economic news – such as weakening labour demand in the United States and subdued retail sales and investment in China – point to a slowdown in activity in the second half of 2025. However, the outlook has been revised up compared with the June 2025 projections, partly reflecting positive data surprises, while fiscal expansion in the United States, receding trade policy uncertainty, and improving financial conditions are projected to cushion the impact of new tariffs.
Global trade growth is projected to decline significantly, to 2.8% in 2025 and 1.5% in 2026, before recovering to 3.1% in 2027. Despite the apparent resilience of trade in the first half of 2025, owing to the frontloading of US imports ahead of the imposition of tariffs, US trade policies are weighing on trade dynamics. The projected sharp slowdown reflects the unwinding of frontloading, as well as the impact of tariffs and elevated trade policy uncertainty – with the latter dampening investment and leading to a less trade-intensive composition of global demand. Global trade is expected to recover in 2027 – notably as US imports rebound after being seen to contract in 2026 – although at a pace somewhat below global real GDP growth. Compared with the June projections, world import growth has been revised down for both 2025 and 2026, mostly reflecting the newly implemented tariffs as well as a downward revision to the assessment of the import-intensity of growth in China which more than offset the impact of upward revisions to real GDP growth.
The outlook for euro area foreign demand remains subdued and has been revised down slightly compared with the June projections. Growth in euro area foreign demand is expected to weaken to 2.8% in 2025, from 3.6% in 2024, and then to slow further to 1.4% in 2026, before recovering to 3.1% in 2027 (Table 2). Compared with the June 2025 projections, euro area foreign demand has been revised down for 2026. The cumulative revisions to euro area foreign demand over 2025-27 are, however, smaller than revisions to global trade, reflecting geographical composition effects – namely higher than expected imports in the United Kingdom in the second quarter and upward revisions for central and eastern European countries on account of the German fiscal stimulus and defence-related spending.
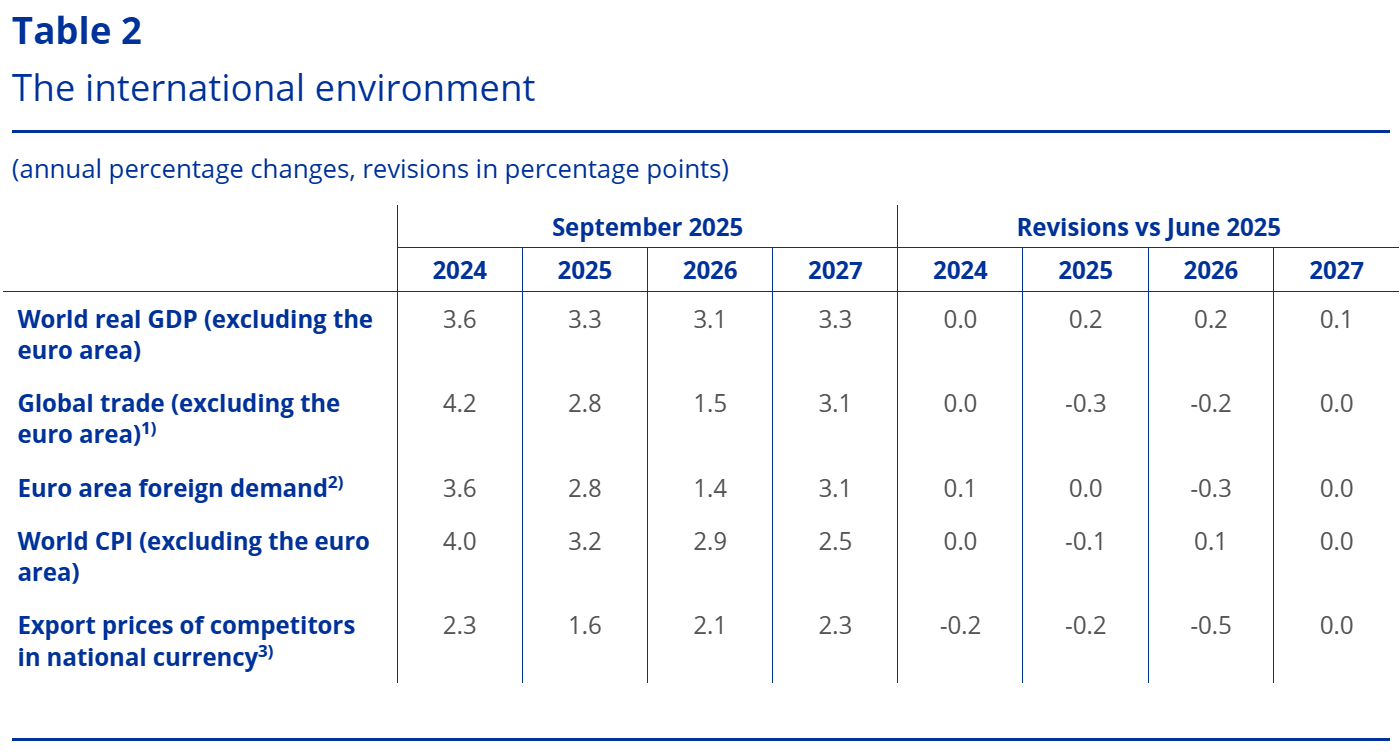
Note: Revisions are calculated from rounded figures.
1) Calculated as a weighted average of imports.
2) Calculated as a weighted average of imports of euro area trading partners.
3) Calculated as a weighted average of the export deflators of euro area trading partners.
Global headline inflation is projected to decline gradually over the projection horizon, notwithstanding inflationary pressures in the United States.[3] Global headline consumer price index (CPI) inflation is projected to moderate from 4.0% in 2024 to 3.2% in 2025, and then to fall further to 2.9% in 2026 and 2.5% in 2027. Compared with the June 2025 projections, global inflation has been revised down slightly for 2025 owing to negative data surprises for the second quarter in large economies (including the United States, China and India), but has been revised up for 2026. The latter is mainly on account of developments in the United States where higher tariffs and the fiscal expansion are projected to intensify inflationary pressures. These developments are partly offset by downward revisions across emerging market economies, reflecting lower than expected consumer price inflation momentum in China and the impact of lower food prices.
Euro area competitors’ export prices are projected to increase at a pace below the historical average, driven by persistently weak export prices in China. Euro area competitors’ export prices (in national currencies) are expected to increase by 1.6% in 2025, 2.1% in 2026 and 2.3% in 2027. This is below the historical average (2.6% over 2000-19) as Chinese export price inflation is projected to remain in negative territory until late 2026. Compared with the June 2025 projections, downward revisions for 2025 and 2026 reflect the impact of lower export prices in China, partly on account of the entrenched deflation of producer prices and lower food prices, which more than compensate for the effect of slightly higher assumptions for oil prices.
Box 1
Assumptions about US tariffs and trade policy uncertainty
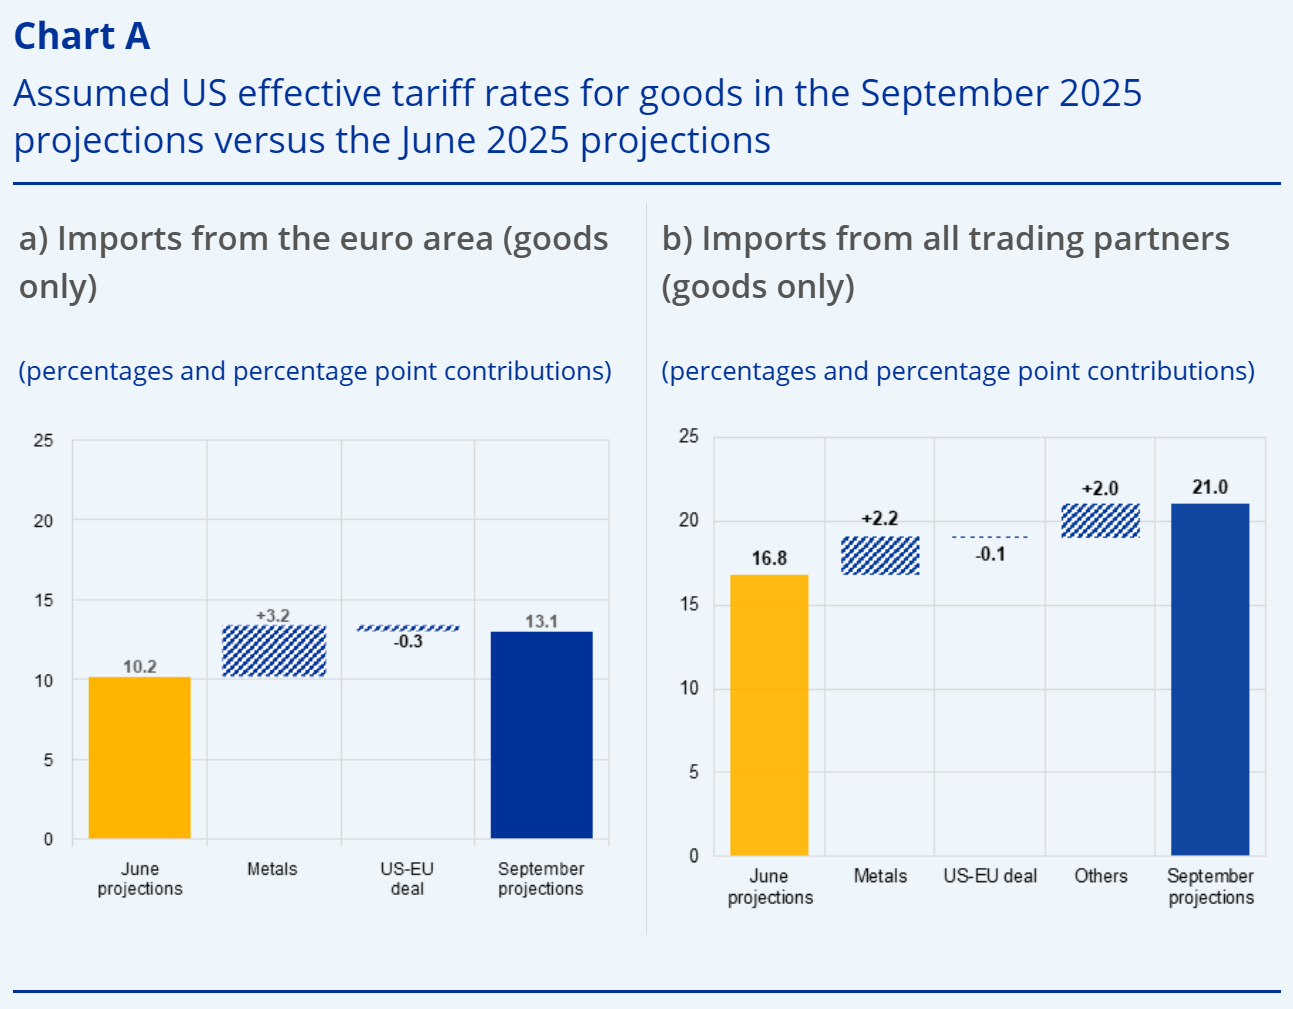
Compared with the June 2025 projections, the US effective tariff rates on euro area imports and those of all its trading partners are higher following the US-EU trade deal and other announcements. The staff projections take into account those tariff rates, pauses and exemptions in effect at the time of the cut-off date for the projections (28 August) and assume that these will remain at the same level over the entire projection horizon.
The effective tariff rate for euro area exports of goods to the United States is assumed to be 13.1%, up from the 10.2% assumed in the June projections (Chart A, panel a). This reflects the trade deal of 27 July 2025 and the subsequent US-EU joint statement, which foresees that the tariff rate applied is the higher of 15% and the most-favoured nation (MFN) rate for all goods that are not affected by sectoral tariffs. This compares with a flat 10% tariff rate assumed in the June 2025 projections. Sectoral tariffs include higher tariffs on steel and aluminium (increasing from 25% in the June projections to 50%) and a new 50% tariff on the aluminium and steel content of 407 products, as well as on copper more broadly. Cars and car components are subject to a 15% tariff (down from 25% in the June projections), while for aircraft and aircraft parts now only the MFN rate applies.[4] For products currently under Section 232 investigation, namely pharmaceutical products, semiconductors and lumber, the tariff is assumed to be at the rate applicable before the Trump Administration took office, which would mean a rate close to zero. When considering also trade in services, the effective tariff rate has increased by 1.8 percentage points to 8.1% from its level in the June projections.The overall US effective tariff rate on goods imports from all trading partners has increased to 21.0%, from 16.8% in the June projections (Chart A, panel b). This reflects the doubling of universal tariffs on steel and aluminium (from 25% in the June 2025 projections to 50%) as well as the addition of 407 steel and aluminium derivatives to the list of tariff-affected products, new universal tariffs on copper (50%), bilateral trade deals signed with key trading partners (e.g. the European Union, Japan, Korea and Vietnam), higher reciprocal rates implemented on 7 August in the case of countries with which no trade deal had been reached (e.g. India and Switzerland), tariff hikes on Brazilian exports (to 50%) and Canadian exports (an increase to 35% in duties on goods that do not comply with the United States-Mexico-Canada Agreement), and secondary tariffs on India (an additional 25 percentage points) to penalise its purchases of Russian oil.
Sources: Conteduca, Mancini, and Borin (2025), CEPII’s ”Base pour l’Analyse du Commerce International” (BACI), World Integrated Trade Solution, Trade Data Monitor and ECB staff calculations.
Notes: Panel a) shows average tariff rates weighted at the product level using 2024 trade data, accounting for permanent and temporary exemptions. “Metals” includes the additional 25% tariff on steel and aluminium and the 50% tariff on copper together with the 50% tariffs on the aluminium and steel content of an additional 407 products. “US-EU deal” includes the 15% tariffs on cars and car components, the MFN rate for aircraft and aircraft parts and the higher of 15% and the MFN rate for other goods. Panel b) shows average tariff rates weighted at the product level using 2023 trade data, accounting for permanent and temporary exemptions. “Metals” covers the doubling of tariffs on steel and aluminium (from 25% in the June 2025 projections to 50% in the September 2025 projections), the 50% universal US tariffs on copper and the 50% tariffs on the steel and aluminium content of an additional 407 products. “Others” includes tariff increases affecting Brazil and Canada, secondary tariffs on India, higher reciprocal rates announced on 1 August 2025 and preliminary trade agreements between the United States and key trading partners (e.g. Vietnam, Japan and Korea).
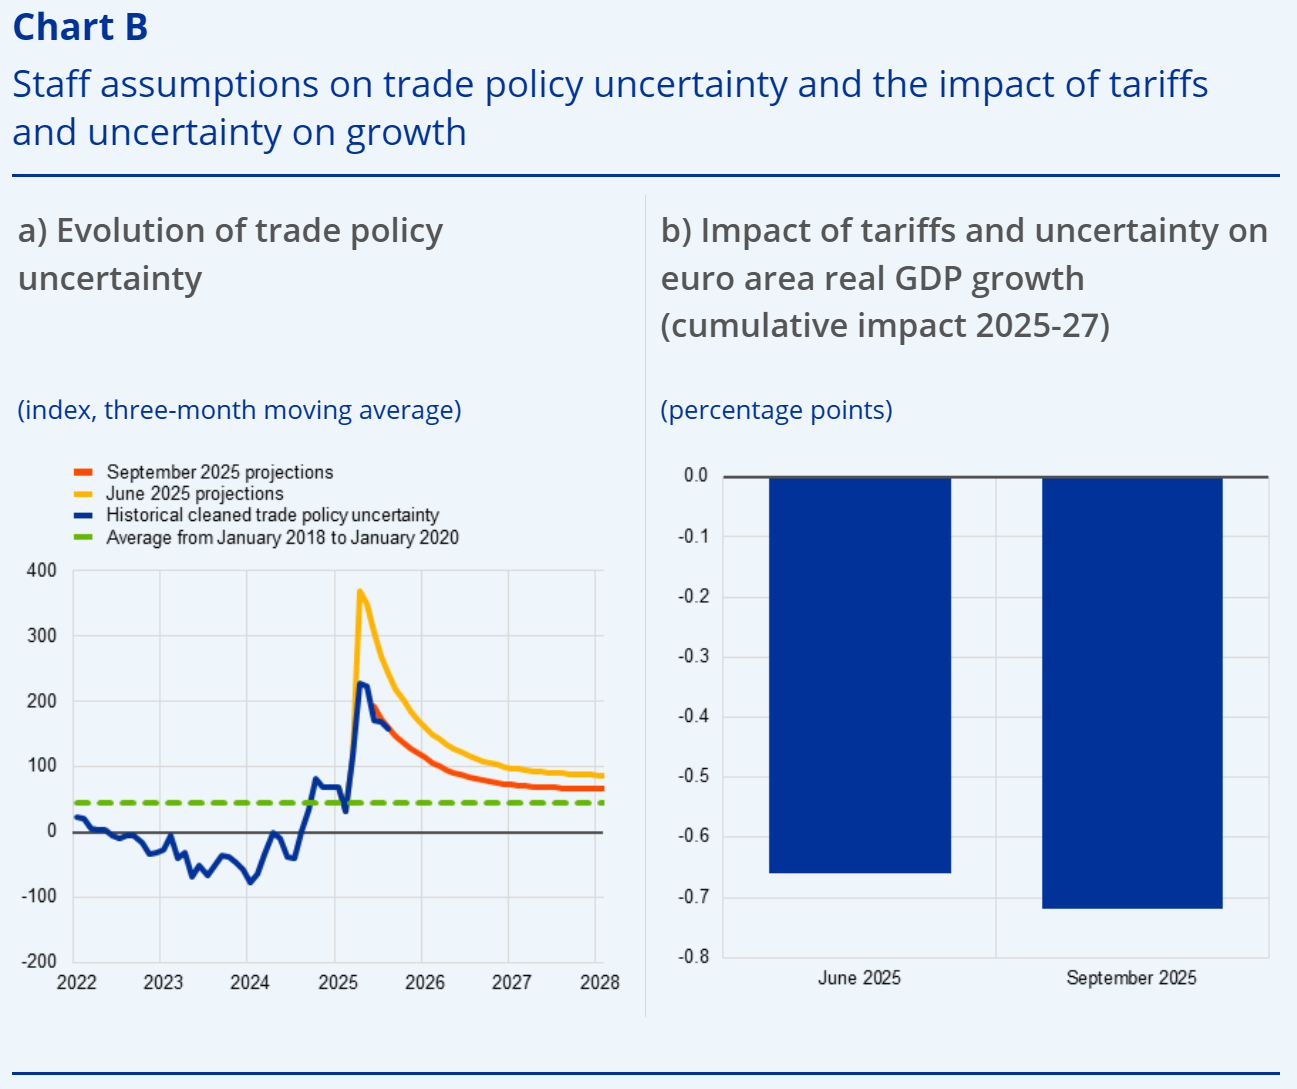
Trade policy uncertainty has declined faster than expected in the June projections, although it remains elevated by historical standards. In July trade policy uncertainty stood roughly 55% below the level assumed in the June projections, mainly on account of the announcement of trade deals.[5] As a result, trade policy uncertainty is assumed to be lower – albeit still elevated –over the projection horizon compared with the previous projections, while following a similar declining path (Chart B, panel a).
Higher US tariffs and trade policy uncertainty since the March projections have reduced the outlook for real GDP growth in the euro area by 0.7 percentage points cumulatively over the period 2025-27 (Chart B, panel b), while the impact on inflation is negligible. The somewhat higher tariff assumptions since June are assessed to imply an additional cumulated impact of -0.1 percentage points compared with the June 2025 projections, concentrated in 2025 and 2026. The limited impact, which excludes exchange rate effects, relates both to the small changes in the effective tariff rates and to the fact that the increases are relatively smaller than for other competitors trading with the United States (Chart A). As regards trade policy uncertainty, the reduction in uncertainty since the June projections has led to a small upward impact on real GDP growth. As a result of these two partly offsetting factors, the overall impact of tariffs and uncertainty on GDP growth is projected to be slightly more negative than in the June projections and amounts to -0.7 percentage points cumulated over 2025-27. As in the June projections, the impact of US tariffs and uncertainty on euro area HICP inflation is seen as very limited, with a cumulated impact over the period 2025-27 of less than 0.2 percentage points.
Sources: Caldara et al., “Does Trade Policy Uncertainty Affect Global Economic Activity?”, September 4 2019, and ECB staff calculations.
Notes: In panel a) the figures refer to a “cleaned” measure of trade policy uncertainty (see footnote 5). The latest observation is for July 2025. For panel b), the estimates exclude the impact of tariffs on the technical assumptions (such as the exchange rate).
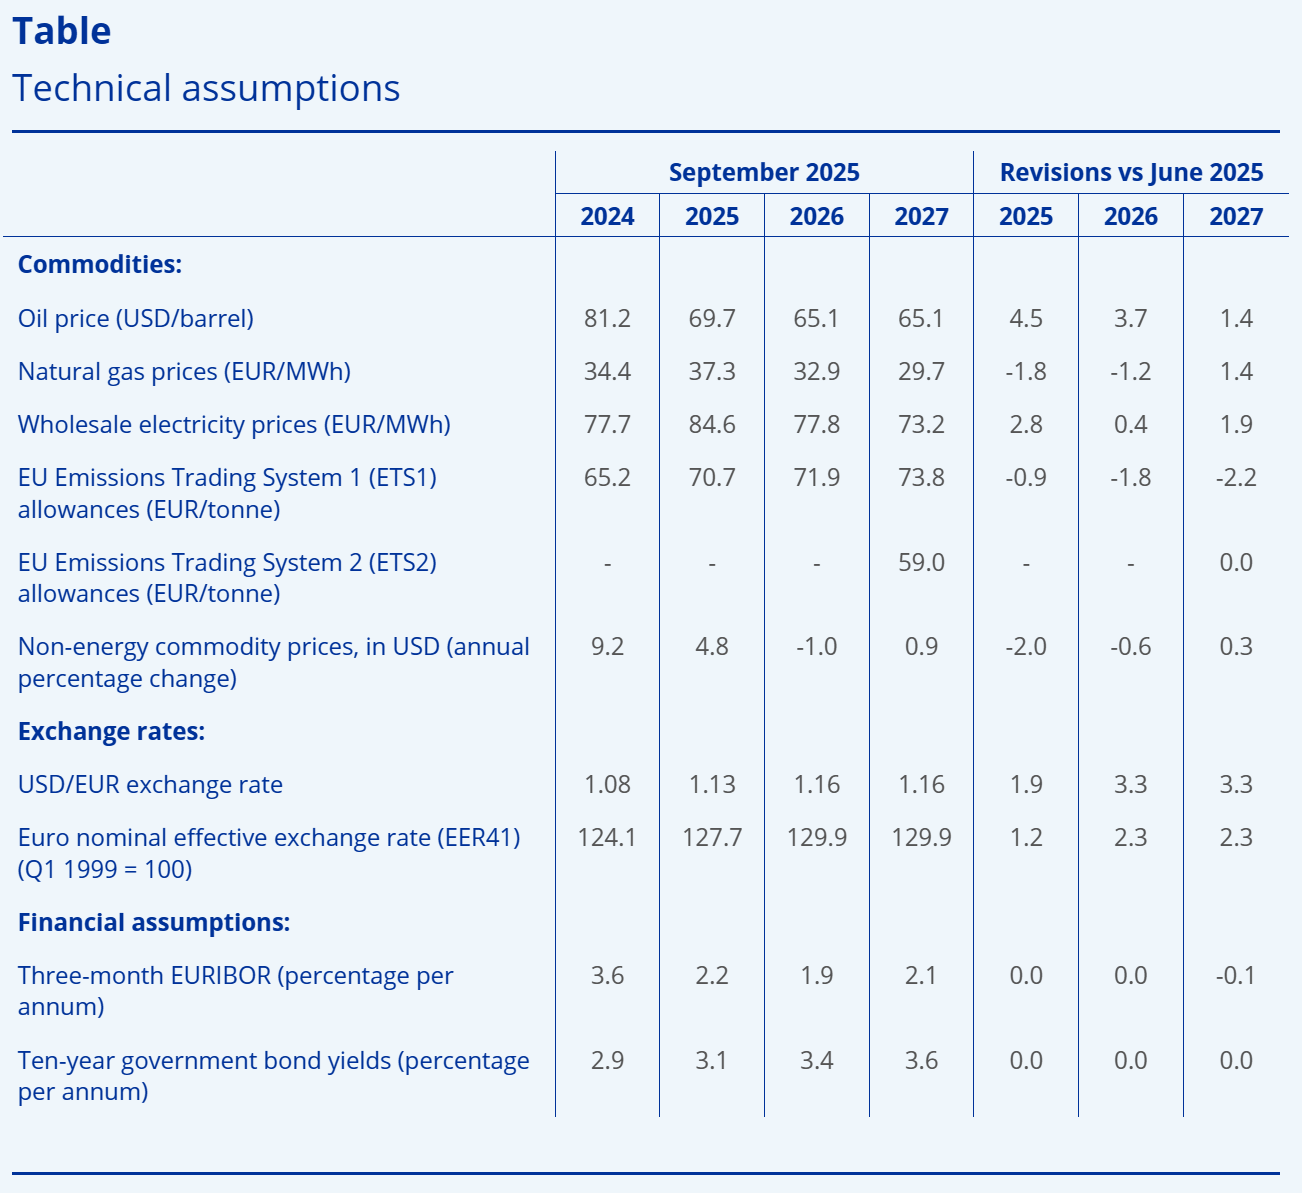
Technical assumptions
Compared with the June 2025 projections, the main changes to the technical assumptions are higher oil prices, lower gas and commodity prices and a stronger euro exchange rate, but the financial assumptions are broadly unchanged. Oil price assumptions have been revised up by around 3% on average for 2025-27, and electricity price assumptions by around 2%, while the assumptions for wholesale gas prices have been revised somewhat down. The price for EU Emissions Trading System 1 (ETS1) allowances is also assumed to be somewhat lower, while for EU Emissions Trading System 2 (ETS2) the price was kept unchanged. Non-energy commodity prices have been revised slightly down. The euro has appreciated by 3.3% against the US dollar and by 2.3% in nominal effective terms since the June projections. The assumptions for interest rates are broadly unchanged.
Notes: Revisions are expressed as percentages for levels and as percentage points for growth rates and percentages per annum. Revisions for growth rates and interest rates are calculated on figures rounded to one decimal place, while revisions reported as percentage changes are calculated on unrounded figures. The technical assumptions about euro area interest rates and commodity prices are based on market expectations, with a cut-off date of 15 August 2025. Oil prices refer to Brent crude oil spot and futures prices. Gas prices refer to the Dutch TTF gas spot and futures prices. Electricity prices refer to the average wholesale spot and futures price for the five largest euro area countries. The “synthetic” future price for ETS1 allowances (EUA) is derived as the end-of-month linearly interpolated value of the two nearest European Energy Exchange EUA futures. Monthly EUA futures prices are then averaged to produce an equivalent to annual frequency. In the absence of meaningful trading of ETS2 allowances, the price assumptions were set by staff at the threshold price above which additional allowances will be released, with the price updated to 2027 prices (for further details, see the box entitled “Assessing the impact of climate change transition policies on growth and inflation” in the December 2024 Eurosystem staff projections). The paths of commodity prices are implied by futures markets in the ten working days ending on the cut-off date. Bilateral exchange rates are assumed to remain unchanged over the projection horizon at the average levels prevailing in the ten working days ending on the cut-off date. The assumptions for euro area ten-year nominal government bond yields are based on the average of countries’ ten-year bond yields, weighted by annual GDP figures. Where the necessary data exist, the country-specific ten-year nominal government bond yields are defined as the ten-year benchmark bond yields prolonged using the forward par yields derived, on the cut-off date, from the corresponding country-specific yield curves. For the other countries, the country-specific ten-year government bond yields are defined as the ten-year benchmark bond yield prolonged using a constant spread (observed on the cut-off date) over the technical euro area risk-free long-term interest rate assumption.
Click to read more