PREFACE
The projections included in this issue of the Fiscal Monitor are drawn from the same database used for the October 2025 World Economic Outlook and Global Financial Stability Report (and are referred to as “IMF staff projections”). Fiscal projections refer to the general government, unless otherwise indicated. Short-term projections are based on officially announced budgets, adjusted for differences between the national authorities and the IMF staff regarding macroeconomic assumptions. The fiscal projections incorporate policy measures that are judged by the IMF staff as likely to be implemented. For countries supported by an IMF arrangement, the projections are those under the arrangement. In cases in which the IMF staff has insufficient information to assess the authorities’ budget intentions and prospects for policy implementation, an unchanged cyclically adjusted primary balance is assumed, unless indicated otherwise. Details on the composition of the groups, as well as country-specific assumptions, can be found in the Methodological and Statistical Appendix of the October 2025 Fiscal Monitor.
The Fiscal Monitor is prepared by the IMF Fiscal Affairs Department under the general guidance of Vitor Gaspar, Director of the Department. The project was directed by Era Dabla-Norris, Deputy Director, and Davide Furceri, Division Chief. The authors of Chapter 1 are Zsuzsa Munkacsi (co-lead) and Galen Sher (co-lead), Krzysztof Bańkowski, Chloe Hyungsun Cho, Gabriel Hegab, Guohua Huang, Salma Khalid, Hongchi Li, Anh Dinh Minh Nguyen, Harilala Onintsoa Raoilisoa Andrianometiana, Danila Smirnov, and Alexandra Solovyeva; with contributions from Nicolo Bird and Alberto Tumino. Meron Haile, Victoria Haver, Xueqi Li, and Andre Vasquez assisted with document preparation. Christine Richmond was an advisor.
The Methodological and Statistical Appendix was prepared by Xueqi Li. Axana Abreu Panfilova from the Communications Department led the editorial team and managed the report’s production, with editorial and production support from David Einhorn, Michael Harrup, Linda Long, MPS Limited, and Absolute Service, Inc.
Inputs, comments, and suggestions were received from other departments in the IMF, including area departments—namely, the African Department, Asia and Pacific Department, European Department, Middle East and Central Asia Department, and Western Hemisphere Department—as well as the Communications Department, Institute for Capacity Development, Legal Department, Monetary and Capital Markets Department, Research Department, Secretary’s Department, Statistics Department, and Strategy, Policy, and Review Department. The report also benefited from comments by António Afonso (Lisbon School of Economics & Management), Leandro Gaston Andrian and Marta Ruiz Arranz (Inter-American Development Bank), Andrew Blazey (OECD), Marco Cangiano, Shu-Chun Susan Yang (Institute of Economics, Academia Sinica), and participants of the IMF workshop, “How Public Spending Can Contribute to Economic Growth—The Role of Spending Efficiency and Composition” on July 18, 2025.
Both projections and policy considerations are those of the IMF staff and should not be attributed to Executive Directors or to their national authorities.
FOREWORD
In the Fiscal Monitor, global public debt is projected to rise above 100 percent of GDP by 2029. In such a scenario, public debt would be at its highest level since 1948. This reflects a higher and steeper path than projected before the pandemic. In addition, the distribution of risks is wide and tilted toward debt accumulating even faster. With a 5 percent risk, debt would reach 124 percent in 2029.
The public debt landscape is very diverse. Countries differ widely in their deficit and debt levels. Many major economies have public debt greater than (or projected to go over) 100 percent of GDP. Although the number of countries with debt above 100 percent will be steadily declining in the next five years, their share in world GDP is projected to rise. Among the Group of Twenty, these are Canada, China, France, Italy, Japan, the United Kingdom, and the United States. These countries typically have deep and liquid sovereign bond markets and often broad policy choices, resulting in their fiscal risk considered moderate. In contrast, many emerging markets and low-income countries face tougher fiscal challenges, despite their relatively low debt. The number of countries with public debt below 60 percent of GDP increased to more than 100 in 2021 and is projected to continue to increase, although their GDP share in the world represents less than 30 percent. Their policy options and funding access are limited. Fifty-five countries are experiencing debt distress or are at high risk of distress despite their debt ratios often below 60 percent of GDP. When countries falter on debt, timely debt restructuring is critical to containing the damage. The IMF is working on strengthening the debt architecture, including through the Common Framework and the Global Sovereign Debt Roundtable. An even better strategy, ex ante, is to maintain safer debt ratios.
Beyond the present, fiscal risks loom large. Public debt dynamics have drastically changed in recent years. It is not only the size of debt but also the cost. The years between the global financial crisis and the pandemic were marked by unusually easy conditions for sustaining debt. Rising debt was accompanied by falling interest rates, leading to an overall stable interest bill on budget. But the situation is now starkly different. Interest rates have increased considerably in global markets, and their path forward is highly uncertain (October 2025 World Economic Outlook). Increasing debt-servicing costs are already pressuring budgets. Financial asset valuations are stretched, financial stability risks loom large, and the possibility of propagation through fiscal-financial adverse feedback loops is particularly concerning (October 2025 Global Financial Stability Report).
Moreover, looming expenditures on defense, natural disasters, disruptive technologies, demographics, and development add to public spending demands. All these pressures and demands come together with sharp political red lines against tax increases and diminished public awareness of fiscal limits. The conclusion is inescapable: starting from too high deficits and debts, the persistence of spending above tax revenues will push debt to ever higher heights threatening sustainability and financial stability.
Prioritizing fiscal policy is essential to support debt sustainability and prepare fiscal buffers to use in case of severe adverse shocks including financial crises. But while we do recognize that the fiscal equation is very hard to square politically, the time to prepare is now. Improving growth prospects and enhancing public trust in government help balance the fiscal equation. Fiscal policy is structural policy. Deploying fiscal structural policy improves growth prospects and reinforces complementarities and synergies with the private sector.
The government can also change the composition of public spending while keeping the overall envelope fixed. For example, tilting the composition of public spending toward growth-friendly areas such as education and infrastructure. The Fiscal Monitor estimates that reallocating 1 percentage point of GDP from current spending to human capital investment leads to an increase of more than 3 percent in GDP by 2050 in advanced economies and almost twice as much in emerging market and developing economies. Enhancing spending efficiency can further amplify these benefits. On the revenue side, countries with insufficient tax capacity should aim at gradually surpassing tax revenues above 15 percent of GDP for a growth takeoff. Growth dividends from such an approach are estimated to be in double digits over the long term. Unfortunately, more than 70 developing countries still have tax-to-GDP ratios below this level, concentrated in fragile and low-income countries. Strengthening governance and institutions, and fiscal transparency, can support these efforts, not least by earning public trust.
Vitor Gaspar
Director
Fiscal Affairs Department
Rodrigo Valdés
Director
Fiscal Affairs Department starting October 27, 2025
EXECUTIVE SUMMARY
Global growth remains lackluster, and public debt is high and rising, with increasing defense spending, aging populations, and higher interest rates putting additional strain on public finances. Governments should take decisive action to strengthen economic growth and rationalize public spending to improve living standards and alleviate fiscal pressures. This Fiscal Monitor explores how enhancing spending efficiency and strategically reallocating resources— particularly toward infrastructure, human capital, and research and development—can improve growth prospects, without increasing overall spending. By implementing these expenditure reforms, governments can not only strengthen economic resilience but also pave the way for a more prosperous future for their citizens.
The potential for reform is substantial. Over the past several decades, public investment as a share of total spending has declined, and expenditure on public education has stagnated. Wage bills are significant, and public sector wages often exceed those in the private sector, distorting labor markets. Rigid spending structures, especially in advanced economies and large emerging market economies, limit the scope for meaningful reform. Despite progress since the 1980s, spending efficiency gaps persist. These gaps are the difference between actual outcomes of public spending and the best outcomes achievable with the same resources. Efficiency gaps currently stand at about 31 percent in advanced economies, 34 percent in emerging markets, and 39 percent in low-income developing countries.
Countries can improve growth prospects by redirecting spending toward areas that increase the economy’s productive capacity. Insights from a new global data set on spending efficiency, combined with analyses of reform episodes and model simulations, demonstrate substantial gains in output. For instance, increasing infrastructure investment by 1 percent of GDP, while keeping overall spending constant by cutting government consumption (such as administrative overhead), is associated with long-term output increases of about 1½ percent in advanced economies and 3½ percent in emerging market and developing economies. The long-term benefits from increasing education spending are even larger, estimated at about 3 percent in advanced economies and 6 percent in emerging market and developing economies.
Enhancing spending efficiency can magnify these gains substantially. Closing efficiency gaps has the potential to increase output by an additional 1½ percent in advanced economies and 2½ to 7½ percent in emerging market and developing economies over the long term, with faster progress yielding even greater benefits. Implementing complementary policies— such as combining investments in human capital and infrastructure in emerging market and developing economies and integrating spending on public education and research and development or fostering technology diffusion in advanced economies—can amplify these positive outcomes even further.
To increase spending efficiency, countries should make institution-building reforms a priority. These reforms should focus on combating corruption and enhancing transparency and accountability through robust mechanisms to control expenditure and publish budgets. Processes for public procurement must be competitive and transparent, especially in advanced economies, where they account for a large share of GDP. Strengthening systems for the management of public investment is critical, with opportunities to enhance project appraisal and ensure maintenance funding. In all countries, improving budget processes is also essential to optimize spending efficiency. Implementing multiyear frameworks for budgeting can effectively connect strategic spending plans with annual budgets. Countries should also leverage digitalization to improve public finance operations and service delivery. Expanding private sector involvement by outsourcing noncore functions of government and collaborating on investment projects can improve spending efficiency and create budgetary space, although this requires careful management of fiscal risks.
Reforming pension and health care systems to ensure their sustainability can create space for growth-enhancing spending. Aligning public sector wages with private sector benchmarks is crucial to effectively manage public wage bills. Better targeting social assistance programs, including consolidating fragmented initiatives in low-income developing countries, can also alleviate fiscal pressures. There need not be a trade-off between pro-growth and equitable spending; in fact, the evidence in this chapter indicates that public spending on investment and education can effectively reduce income inequality.
Governments should leverage tools such as spending reviews to optimize existing resources and ensure that public money delivers lasting benefits. To maximize impact, they should design these reviews thoughtfully and integrate them into budgetary processes. Countries with limited capacity can benefit from incorporating elements of frameworks for reviewing spending, such as benchmarking and performance indicators.
CHAPTER 1 SPENDING SMARTER: HOW EFFICIENT AND WELL-ALLOCATED PUBLIC SPENDING CAN BOOST ECONOMIC GROWTH
Introduction
Economic growth has remained persistently subdued since the COVID-19 pandemic, with growth in labor productivity having slowed in about 70 percent of economies (April 2025 World Economic Outlook, Chapter 1). Compounding this challenge are substantial strains on public finances, driven by elevated and rising debt levels, as well as increased demands for spending on defense, aging populations, and economic development. In addition, low-income developing countries are bracing for a reduction in foreign aid (April 2025 Fiscal Monitor, Chapter 1).
This constrained fiscal environment demands that governments deliver greater value for money and strategically adjust expenditures to support economic growth. Revitalizing growth not only improves living standards but also eases fiscal pressures by increasing public revenues and making public debt more sustainable, thereby creating additional space for other priority spending.1 Although public spending serves many objectives—such as providing public goods, ensuring a fair distribution of income, and stabilizing economic cycles (Musgrave and Peacock 1958)—the current context underscores the need to prioritize policies that reinvigorate economic growth and mitigate fiscal risks.
This chapter examines how policymakers can change the composition of public spending within a fixed total spending envelope to lift economic growth. It focuses on the potential gains to output from actions in two complementary areas. The first, technical efficiency, maximizes output for a given level of resource use, focusing on broad categories of expenditure. The second, allocative efficiency, assigns priorities to spending items and directs resources toward programs that promote growth. Actions in both areas are essential because they complement each other— increased efficiency amplifies the effects of pro-growth spending.
This chapter addresses three key sets of questions:
1. How have the composition and efficiency of public spending evolved over time, and how do they compare across country groups? What are the “efficiency gaps” that indicate how far the efficiencies of countries’ spending are from those of the most efficient countries?
2. What factors, including policies and institutions, influence the efficiency and composition of public spending? Does the degree of “rigidity” of public spending—defined as institutional, legal, contractual, or other constraints that limit a government’s ability to change the size and structure of public spending in the short term—hinder a government’s ability to adjust spending for growth and efficiency?
3. If countries close the gaps in the efficiency of their public spending, how much could output increase in the medium to long term? Does pro-growth spending within a fixed spending envelope yield greater benefits in countries with higher levels of spending efficiency? What mechanisms drive this output impact?
To answer these questions, this chapter introduces novel global data sets on the efficiency and rigidity of public spending since 1980 and 2000, respectively. Combining these data sets with empirical and theoretical models, as well as with country case studies, leads to the following main findings:
• Many countries have significant scope to reallocate public spending toward areas that enhance economic growth. Current public spending allocations do not effectively promote growth. For instance, public investment has declined globally to 18 percent of total expenditure, whereas the share of public education spending in total expenditure has remained modest at about 11 percent. Public wage bills are particularly high, accounting for about one quarter of total expenditure.
• Almost all countries have the potential to increase the efficiency of their public spending. Although there has been some progress in increasing spending efficiency, progress has stalled and gaps in spending efficiency persist at about 31 percent in advanced economies, 34 percent in emerging markets, and 39 percent in low-income developing countries. This means that countries could get 30 to 40 percent more value for money by adopting the practices of the best performers. These gaps are particularly pronounced in public spending on investment and research and development (R&D).
• Stronger institutional frameworks are associated with higher levels of efficiency in public spending and a composition of spending that is more favorable to growth. Countries with lower levels of corruption, stronger rule of law, and more effective processes to manage public investment spend more efficiently and exhibit lower degrees of spending rigidity. Well-designed reviews of spending—that is, systematic analyses of public expenditure to evaluate its consistency with policy priorities and identify savings opportunities—can be effective tools to optimize public spending. Following these reviews, countries often successfully reduce their public wage bills and increase the efficiency of their public spending.
• Redirecting public spending can deliver significant gains in output. For instance, increasing investment in infrastructure by 1 percent of GDP, while holding spending constant overall, is associated with an increase in output of about 1½ percent in advanced economies and 3½ percent in emerging market and developing economies over the long term. Similarly, public spending on education can have substantial long-term benefits. Reallocating 1 percent of GDP from government consumption (for example, spending on administrative overhead) to public human capital (for example, enhancing national curriculums and equipping schools) can lift output by 3 percent in advanced economies and 6 percent in emerging market and developing economies.
• Closing gaps in the efficiency of public spending magnifies these gains in output. Gradually closing such gaps could lift output by a further 1½ percent in advanced economies and 2½ to 7½ percent in emerging market and developing economies over the long term. Accelerating the closure of these gaps could further increase the gains in long-term output by 2 percent.
• Complementary policies can augment these gains. Reallocating public spending toward both R&D and human capital investment maximizes output gains in advanced economies. In emerging market and developing economies, a combination of investment in human capital and infrastructure is beneficial to harness both the short-term gains from investment in infrastructure and the longer-term gains from development of human capital.
Developments in Public Spending
This section presents stylized facts regarding developments in public spending and examines the potential to adjust the composition and efficiency of public spending to promote economic growth.
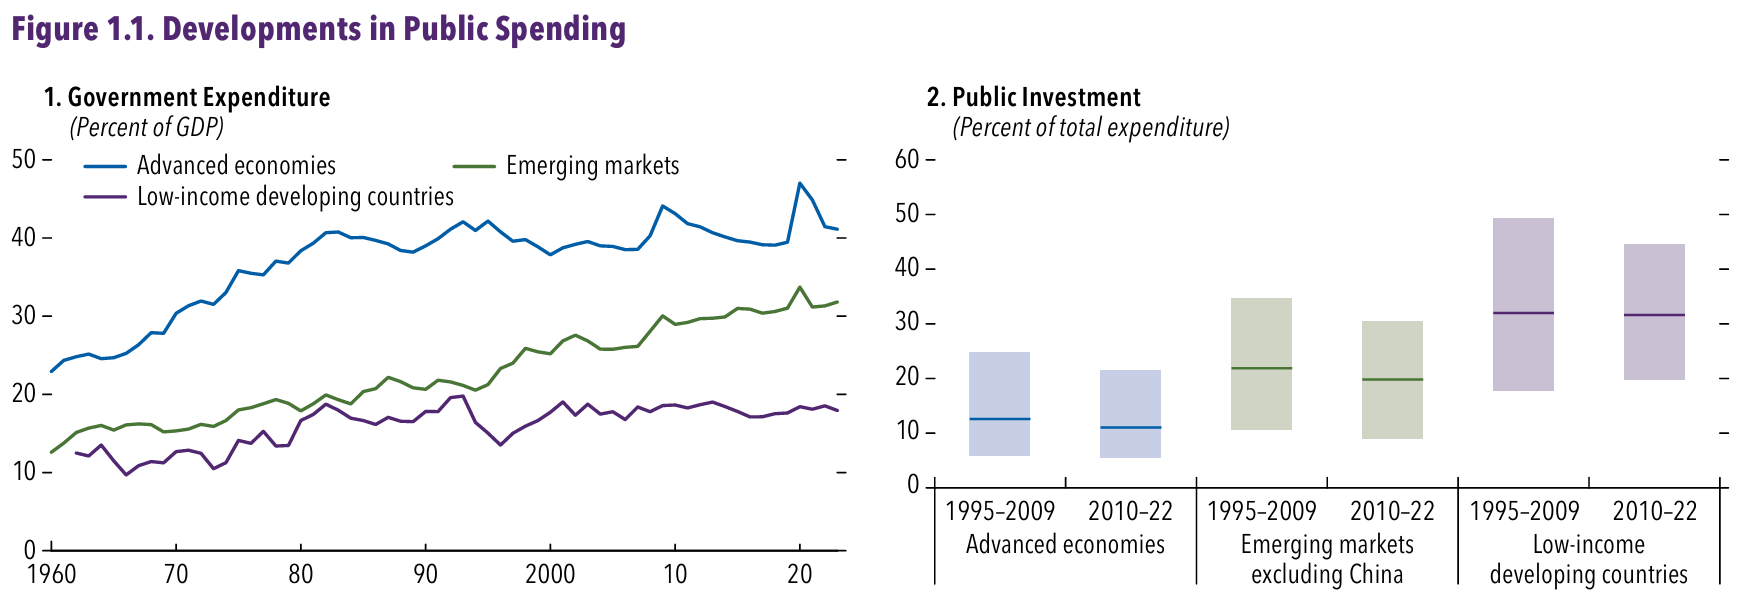
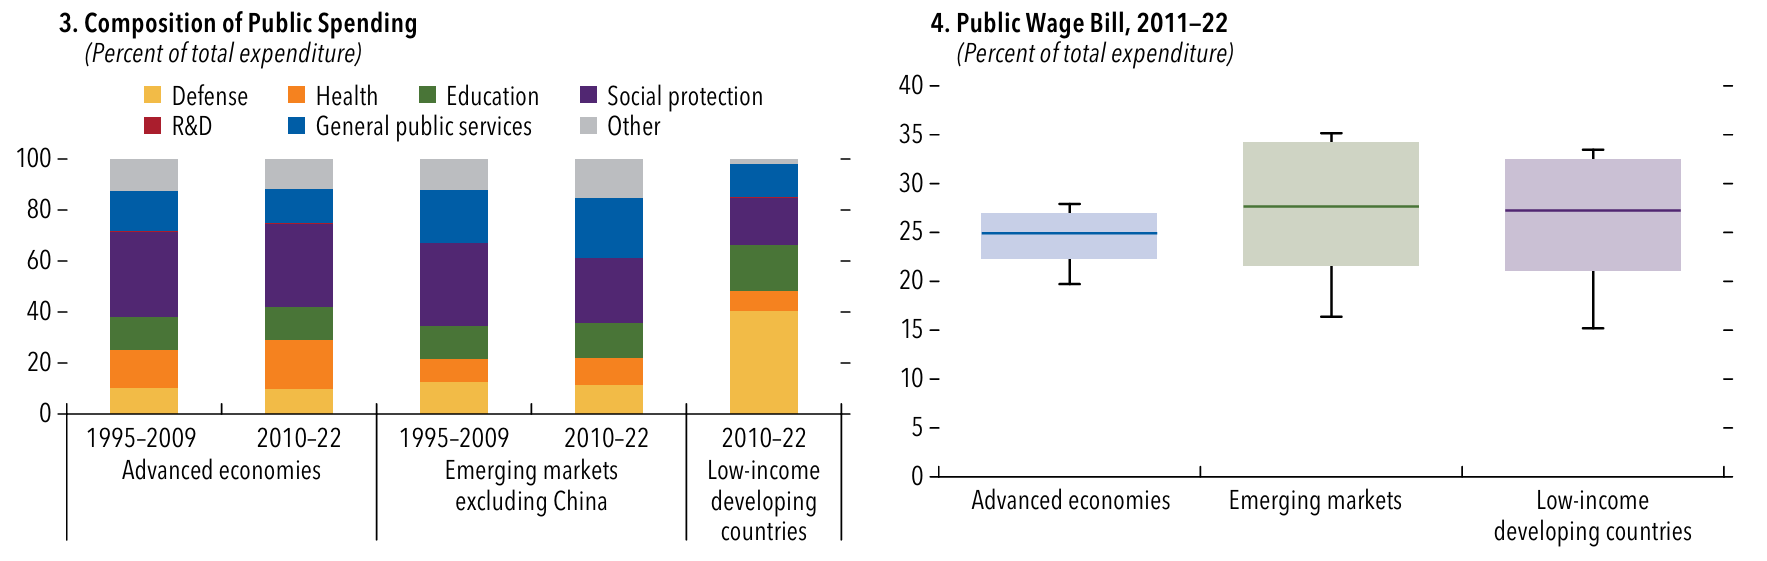
Pro-Growth Public Spending Government expenditure globally has increased substantially over the past several decades. Since the 1960s, general government spending relative to GDP has doubled in advanced and emerging market economies, reaching 42 and 32 percent of GDP in 2023, respectively (Figure 1.1, panel 1). In low-income developing countries, levels of public spending are lower and have grown less substantially, reaching 18 percent of GDP in 2023. These patterns are consistent with Wagner’s law, which posits that public spending increases as economies develop and citizens demand more public services. The patterns also reflect lower capacity for generating revenue in low-income developing countries (Benitez and others 2023).
Governments allocate modest shares of total expenditure to categories of spending that enhance an economy’s productive capacity—and those shares have declined over time.2
• Public investment accounts for a relatively low share of total expenditure and that share has declined globally (Figure 1.1, panel 2).
Sources: IMF, FAD Government Compensation and Employment Dataset; IMF, Government Finance Statistics; IMF, Public Finances in Modern History database; IMF, World Economic Outlook database; and IMF staff calculations.
Note: Spending refers to general government spending. In panel 1, country group averages are weighted by nominal GDP measured in constant international dollars at purchasing power parity. In panel 2, the boxes show the simple average within each income group and 10th–90th percentile ranges. Panels 2 and 6 depict annual averages in the indicated periods. Panel 3 presents US dollar GDP-weighted averages within each income group. “Defense” includes spending on public order and safety. In panels 4–6, the boxes show simple averages and interquartile ranges; whiskers show 10th–90th percentile ranges. In panel 6, the highest level of rigidity is a value of 1. R&D = research and development.
From 1995–2009 to 2010–22, the public investment share fell from 13 to 11 percent in advanced economies and from 22 to 20 percent in emerging markets (excluding China) and stayed at 32 percent in low-income developing countries. Countries such as Japan and Portugal substantially reduced their allocations for public investment between the two time periods. Globally, underinvestment and depreciation have caused public capital stocks to decline relative to GDP (October 2020 Fiscal Monitor, Chapter 2). In advanced economies, public investment now accounts for about one-third of spending on social protection, with the shift partly reflecting better infrastructure, higher levels of investment in infrastructure by the private sector, and population aging. Low-income developing countries, however, have higher shares of public investment in total expenditure, with significant infrastructure needs driving the greater allocations.
• Public spending on health, education, and R&D combined accounted for 32 percent of total spending for advanced economies, 24 percent for emerging markets, and 27 percent for low-income developing countries, on average, in 2010–22 (Figure 1.1, panel 3). Although public spending on health and R&D has increased slightly relative to total public expenditure in the last decade, public spending on education has either declined or remained stagnant in most countries. Although the decline in education spending is partly explained by the declining school-age population in advanced economies, it has fallen even on a per-pupil basis in emerging markets.
A substantial portion of public spending consists of wage bills, which account for about 25 percent of total expenditure in advanced economies and 28 percent in emerging market and developing economies, on average (Figure 1.1, panel 4). Regional differences are notable, with spending on the compensation of public sector workers ranging from 22 percent of total expenditure in the Caucasus and Central Asia to 33 percent in the Middle East and North Africa. In addition, there are large differences within country groups. For example, the wage bill in Denmark is high relative to total public expenditure, whereas Germany and Japan allocate significantly less to public wages because lower percentages of their workforces are employed in the public sector.
Public wage bills overlap substantially with certain functional categories of spending such as education. Wages account for about 69 percent of public spending on education globally. For example, tackling teacher shortages in lower-income countries or attracting higher-skilled teachers might increase spending on public wages. In general, if public compensation is uncompetitive, governments might be unable to attract adequately skilled workers to provide quality services (IMF 2016). However, rising public sector wages might pressure wages across the economy, because public wages often serve as benchmarks for private sector compensation. Premiums on public sector wages—the difference between wages earned by workers in the public sector and the wages of similarly qualified workers in the private sector—average about 13 percent in emerging markets and 10 percent in low income developing countries (Figure 1.1, panel 5).3 These wage premiums can distort labor markets by restricting the labor supply available to the private sector (IMF 2016).
Rigidity in Public Spending
A lack of flexibility to adjust public spending from one year to the next—that is, the rigidity of public spending—partly results from the nature of budget cycles, which involves a number of different actors from all levels of government (Herrera and Olaberria 2020). Rigidity in public spending can stem from different sources, including characteristics of budget processes, structural developments within an economy, and forces relating to the political economy. Although some degree of spending rigidity can be beneficial—such as that arising from commitments to multiyear investment projects or the pursuit of long-term goals—rigidity may also arise from legally mandated expenditures, such as spending on pensions for aging populations. During periods of macroeconomic volatility, fiscal pressures, or crises, a high degree of spending rigidity may hinder needed expenditure reforms. It is also often linked to inefficient processes for budgeting, especially in emerging market and developing economies. Stronger medium-term budgetary frameworks can allow for more opportunities to shift spending into different, more strategic areas (Harris and others 2013).
This chapter provides a novel data set of estimates of the rigidity of public spending for 151 countries between 2000 and 2022.4 The estimates suggest that public spending has a higher degree of rigidity in advanced economies, even though the degree has declined slightly in recent years. The estimates are 0.33 for advanced economies, 0.26 for emerging markets, and 0.29 for low-income developing countries, on average, during 2011–22 (Figure 1.1, panel 6). This indicates that in advanced economies, approximately one-third of spending is unlikely to change in the short term. Spending in economies such as China, New Zealand, the United Kingdom, and the United States is particularly rigid, whereas spending is relatively flexible in Iceland and Thailand. Economies such as Canada, Estonia, and Sweden have reduced their spending rigidity over time, in line with strengthening multiyear fiscal frameworks that require new spending to be offset in future years and implementing performance based budgeting.
The higher degree of rigidity in public spending in advanced economies is not solely attributable to entitlements such as pensions or social assistance. Rather, rigidity is evident across all categories of public spending in these economies. The most rigid categories of public spending in advanced economies are health, education, and social protection, whereas in emerging markets, they are public investment and defense and public order.
Efficiency of Public Spending
This chapter also introduces a novel global data set of estimates of public spending efficiency that vary over time and account for structural differences across countries, as well as uncertainty regarding the number and choice of key variables used.5 The efficiency of public spending is defined as how effectively governments maximize outputs (or outcomes) using a fixed level of inputs (public expenditure). It measures the gap between observed outcomes and those that could be achieved under the best management practices, technology, and institutions. This “production possibility frontier” illustrates the highest level of output attainable from given public spending inputs, thereby reflecting the performance of the most efficient countries within the sample. The data set benchmarks public spending on investment, health, education, and R&D for 174 countries between 1980 and 2023.
The inputs for spending in these areas are five year averages. They are paired with outcome variables commonly used in the literature (Apeti, Bambe, and Lompo 2023; Herrera, Isaka, and Ouedraogo 2025). Public investment outcomes include both quantitative measures—such as transport and telecommunications infrastructure—and assessments from international surveys on infrastructure quality (see Online Annexes 1.1 and 1.2 for details). In the case of health spending, outcomes encompass life expectancy, numbers of hospital beds and doctors, and immunization rates, among other measures. Outcomes for education spending are measured using indicators such as enrollment and completion rates, average years of schooling, literacy rates, and pupil-to-teacher ratios. Outcomes for R&D spending include numbers of patent applications, publications in scientific journals, citations of publications, and researchers.
Measuring efficiency gaps across a large sample of countries presents challenges. First, the multifaceted nature of public services complicates the aggregation of outputs, necessitating multioutput approaches to accurately capture the full spectrum of government production. Second, inconsistencies in measuring public services across countries, such as reliable access to electricity, require the use of proxy variables. In addition, distinguishing between controllable inefficiencies and external factors is critical, as outcomes may reflect random fluctuations or shocks rather than systematic inefficiencies. Finally, estimates of efficiency must account for cross-country differences, particularly regarding countries’ stages of development. The estimates provided in this chapter attempt to account for these considerations (see Online Annex 1.2) and yield several insights.
Source: IMF staff estimates.
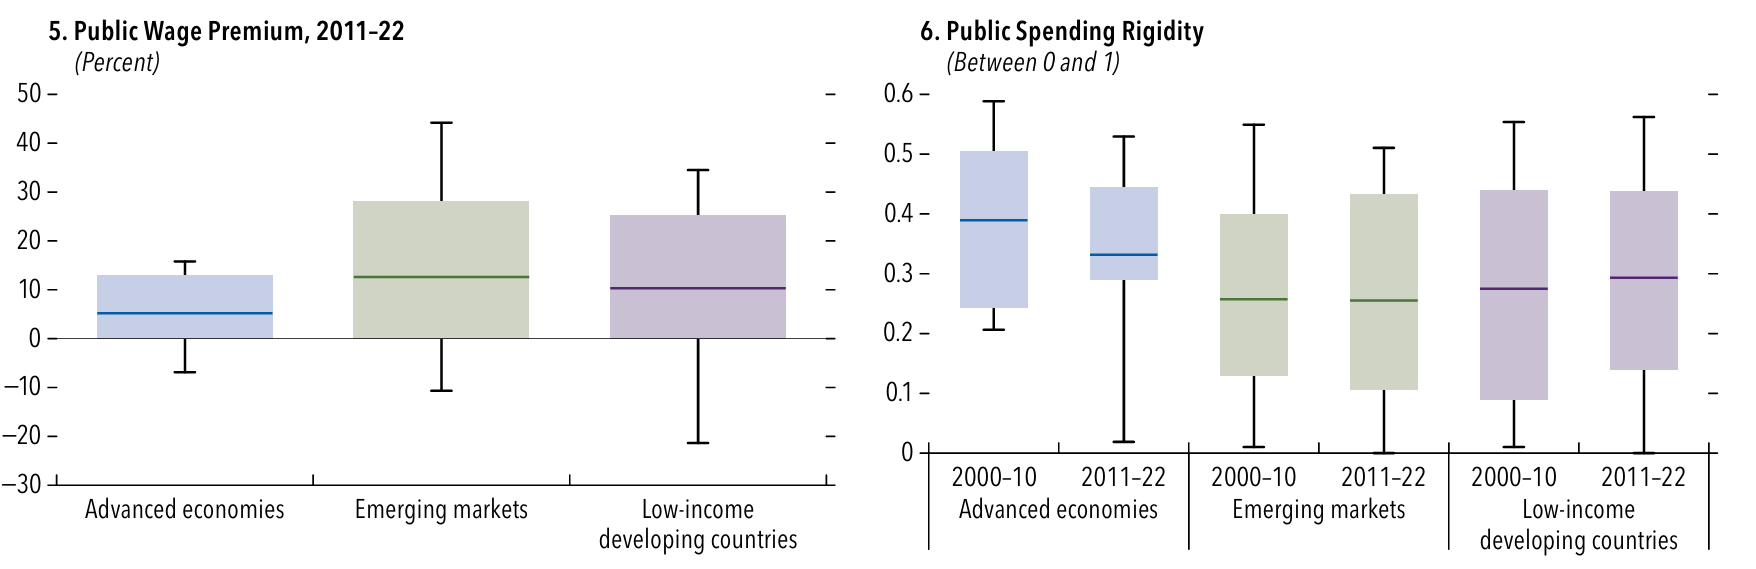
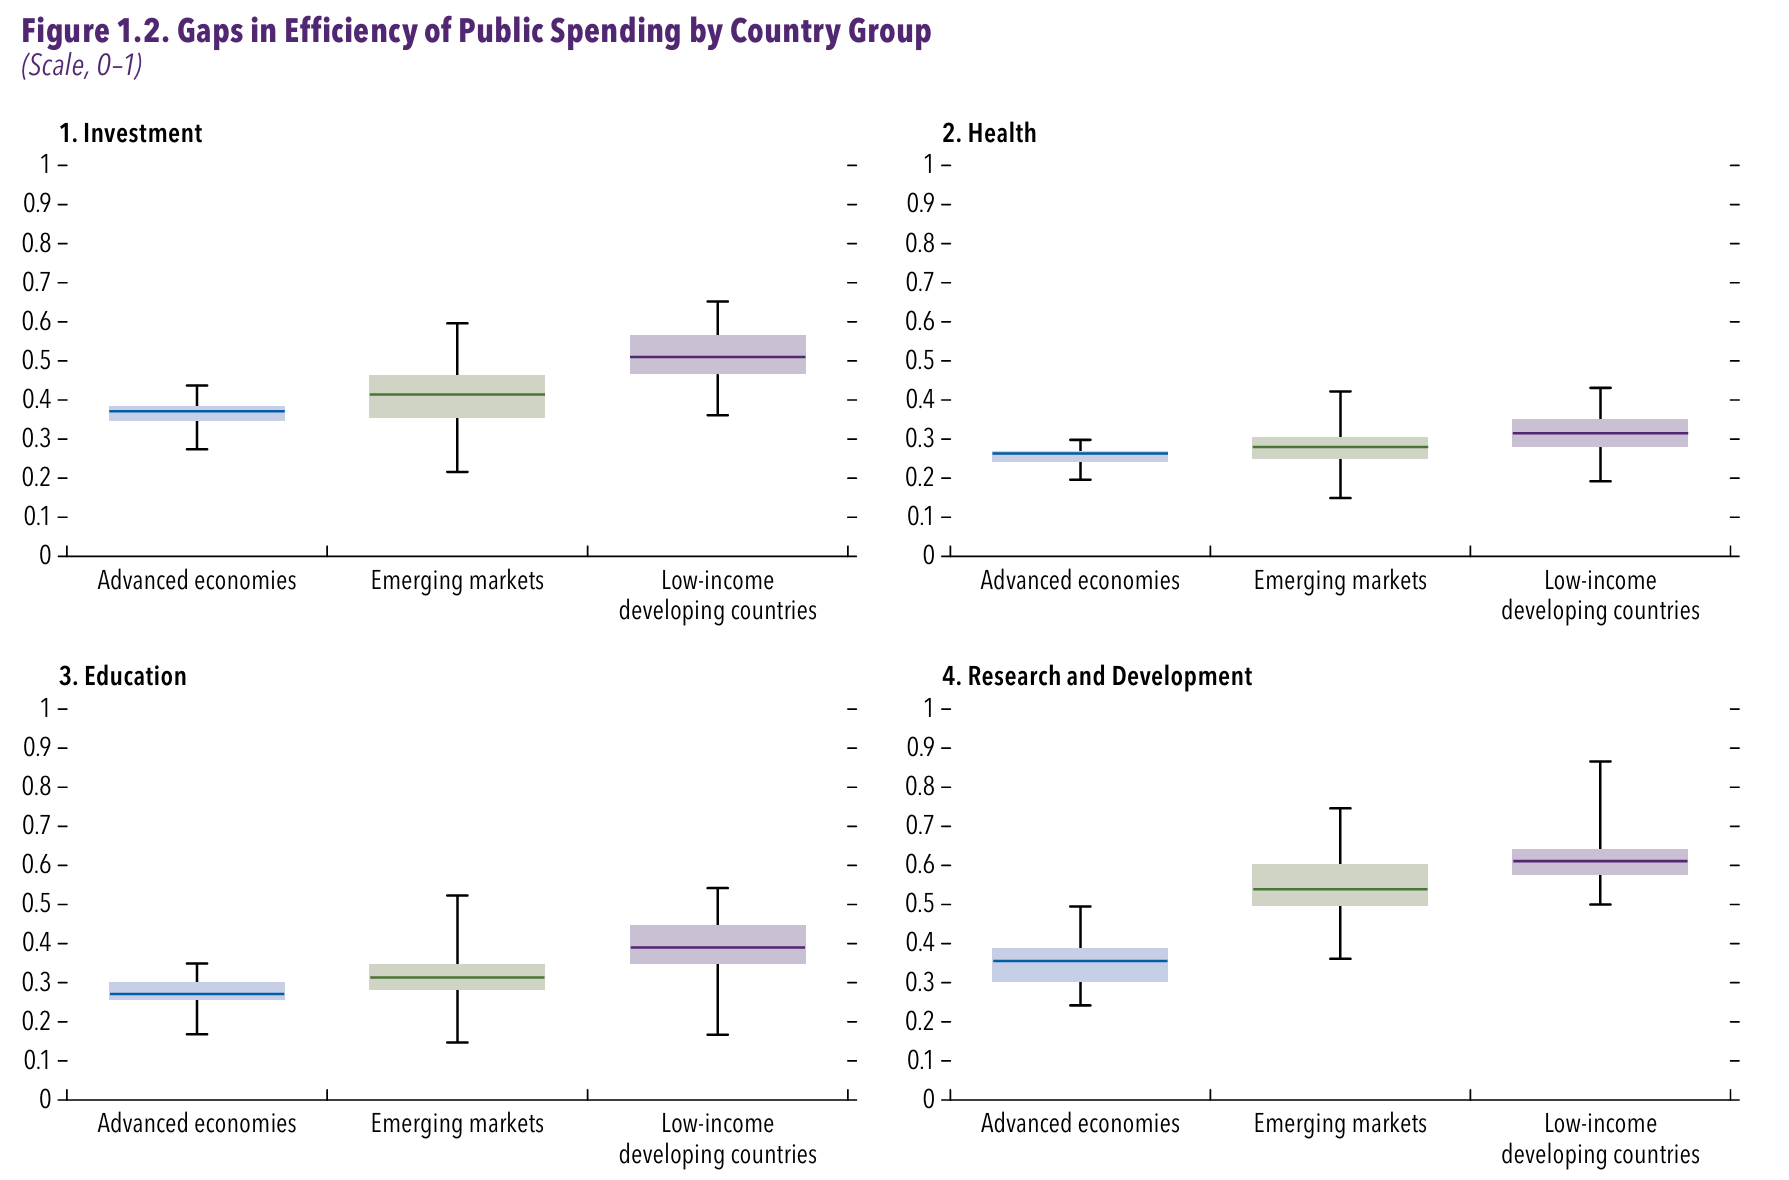
Note: The figure shows efficiency gaps, which are distances to the spending efficiency frontier. Efficiency gaps range from 0 (fully efficient) to 1 (fully inefficient). The frontier is estimated using stochastic frontier analysis, as described in the text and detailed in Online Annex 1.2. Boxes indicate regional medians and interquartile ranges (25th–75th percentiles) of the average efficiencies over time. Whiskers delineate the minimum and maximum values.
The estimates reveal significant efficiency gaps between the spending efficiencies of a number of countries and those of the most efficient countries (Figure 1.2). Historically, the efficiency gap for public spending on investment has averaged about 38 percent in advanced economies, 42 percent in emerging markets, and 53 percent in low-income developing countries. More developed economies typically exhibit higher levels of efficiency, reflecting greater administrative capacity, more effective planning, and stronger institutions, as outlined later in the chapter. Conversely, gaps in the efficiency of public spending on health and education tend to be lower, as increased spending in more developed countries partly offsets their higher levels of achievement in such outcomes as life expectancy and school enrollment.
Efficiency gaps in health spending have averaged about 26 percent in advanced economies, 28 percent in emerging markets, and 32 percent in low-income developing countries, whereas gaps in education spending average about 27, 32, and 40 percent, respectively. Efficiency gaps are particularly pronounced in public spending on R&D, as a handful of countries dominate patent applications and scientific publications. These estimates confirm the finding from existing studies—particularly OECD (2017); Apeti, Bambe, and Lompo (2023); Garcia-Escribano, Juarros, and Mogues (2022); Kapsoli, Mogues, and Verdier (2023); Herrera, Isaka, and Ouedraogo (2025)—that inefficiencies in public spending are substantial.
Source: IMF staff estimates.
Note: The figure shows efficiency gaps, which are distances to the spending efficiency frontier. Efficiency gaps range from 0 (fully efficient) to 1 (fully inefficient). The frontier is estimated using stochastic frontier analysis, as described in the text and detailed in Online Annex 1.2. Lines indicate unweighted group means. Shaded bands show interquartile ranges (25th–75th percentiles).
The efficiency of spending varies widely across regions and countries. On average, Europe and the Americas have the lowest gaps in efficiency, compared with other regions (see Online Annex 1.2 for regional estimates). Small developed countries such as Latvia and Slovenia achieve solid outcomes in infrastructure, despite below-average levels of public investment. In contrast, many African countries—such as the Central African Republic and South Sudan—have unfavorable outcomes in infrastructure even after adjusting for their low levels of spending, resulting in large gaps in efficiency. These countries’ inefficiencies are often linked to acute challenges related to conflict, capacity constraints, and weaknesses in governance.
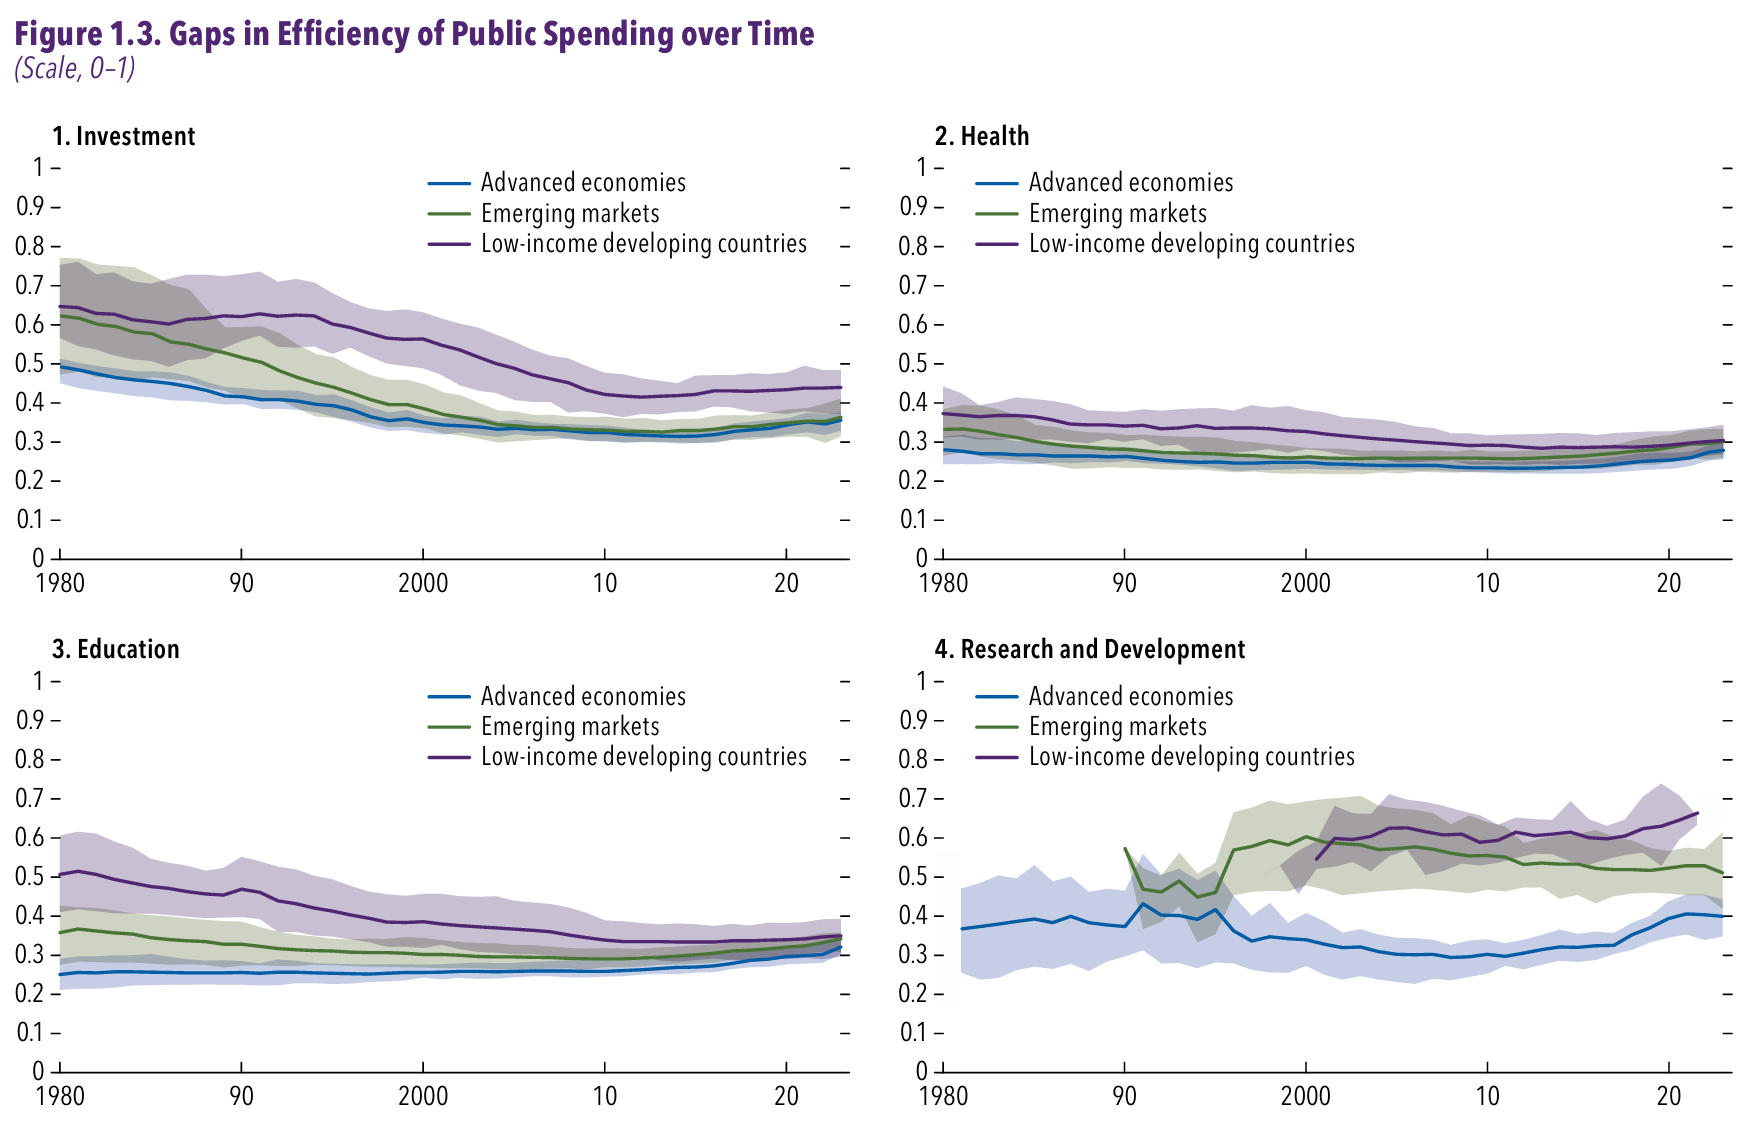
Gaps in the efficiency of public spending have narrowed considerably over the past four decades (Figure 1.3), with countries such as Bangladesh and Rwanda having dramatically improved their efficiency in the past decade. Low-income developing countries have expanded access to basic infrastructure, and advanced economies have achieved wide mobile phone coverage without increasing public investment. Increases in life expectancy have been broad-based, and although education expenditures per person have increased globally, the increases have only been substantive in advanced economies. However, progress has stalled recently, especially in advanced economies, as health spending has increased. In recent years, gaps in the efficiency of pro-growth spending have averaged 31 percent in advanced economies, 34 percent in emerging markets, and 39 percent in low-income developing countries.
Click to read more