Executive Summary
Tax capacity is central to state capacity and sustainable development. Recent research suggests that developing countries should aim for a tax-to-GDP ratio of at least 15 percent—enshrined in the United Nations (UN) Compromiso de Sevilla (Seville Commitment)1—to achieve stronger institutions, deeper financial markets, and sustainable economic growth.
Tax revenue in many developing countries remains persistently below 15 percent, with little progress over the past decade. Today, 71 developing countries have tax-to-GDP ratios below 15 percent. Of these, 23 are fragile and conflict-affected states (FCSs), 38 are resource rich, and 40 are in the low-income group. Estimates suggest that low-income developing countries could on average mobilize about 5 percent of GDP in additional tax revenues through comprehensive reform of their tax system. Yet many in this group will need to further improve their institutional capacity to reach a 15 percent tax-to-GDP ratio.
Tax system approach. Effective revenue mobilization requires close integration of tax policy, tax law, and revenue administration—reflected in what has come to be known in the tax literature as the “tax system approach.” Grounded in this approach, the medium-term revenue strategy offers a comprehensive reform path to achieve tax ratios of at least 15 percent of GDP. However, many low-income developing countries, especially FCSs, may need to start with a more pragmatic, sequenced approach as discussed in this IMF Departmental Paper. Options for tax design and revenue administration include the following:
Tax Design
Base broadening: International experience shows revenue is best mobilized by broadening the tax base—through rationalizing tax expenditures, improving value-added tax (VAT) design, and limiting exemptions—rather than by raising already high statutory tax rates on compliant taxpayers.
Improving indirect taxes: VAT often underperforms in low-tax countries where rationalizing exemptions and preferential rates could nearly double revenue. Excises are easy to administer and justified by health or environmental goals, with untapped potential in developing economies.
Reforming tax incentives: Investment tax holidays and exemptions are often ineffective and costly. Cheaper alternatives are investment credits and accelerated depreciation.
Simple taxes. Tax design could initially prioritize simplicity and feasibility as administrative capacity is being developed, for example, by using taxes with a few collection points and final withholding taxes.
Diversifying revenue sources: Personal income tax expansion, stronger natural resource taxation, and property taxes can mobilize revenue in equitable ways.
Tax Compliance
Cultivating tax compliance. Governments can promote tax compliance by establishing administrative presence in the whole country, investing in tax education programs, working in partnership with other government agencies and civil society organizations, and promoting open communication on tax issues.
Simplicity and practicality. There are broad benefits to the revenue administration and to taxpayers from adopting clear norms, transparent rulings, simple tax forms, harmonized procedures, user-friendly IT systems, and easy collection entry points.
Compliance risk management. Differentiating taxpayers based on their size and compliance behavior is an effective approach, including combining large taxpayer offices to secure revenue for relevant economic sectors with streamlined administration for small taxpayers to encourage formalization and “normalize” compliance.
Digitalization. Adopting simple and flexible digital solutions that can be expandable over time, starting with core functions (for example, registration, return filing, payments) for large taxpayers can be especially effective in low-capacity environments.
Governance. Promoting capable and consistent leadership, adopting clear rules governing integrity, engaging in financial management and reporting, implementing strong internal and external oversight functions, investing in recruiting and training people based on meritocratic principles, and managing through goals setting and performance monitoring are the foundation for good governance of revenue institutions and are key to encouraging tax morale and taxpayer compliance.
Building tax capacity is ultimately a domestic political process, rooted in each country’s social contract. Yet capacity development—through technical advice, training, and peer learning—has proven effective in strengthening tax systems, particularly in low-income and FCSs. Tax capacity building is a central part of the IMF’s work and integrated with surveillance and lending. To maximize impact, it is comprehensive, country-led, and aligned with broader fiscal and macroeconomic reforms. The new Global Public Finance Partnership embodies this approach, coordinating international support to help countries mobilize domestic revenue and advance the Sustainable Development Goals, as emphasized in the Compromiso de Sevilla.
Acronyms and Abbreviations
Introduction
Strengthening tax capacity has long been a central priority for developing countries. The UN Sustainable Development Goals (SDGs), adopted in 2015, explicitly call for “improved domestic resource mobilization, including through enhanced capacity for tax and other revenue collection.” An adequate tax capacity is widely recognized as a critical foundation for financing public services, infrastructure, and social development and a key aspect of state building to support the economy. Yet despite international commitments and reform efforts, progress during the past decade has been modest and uneven across countries.
The urgency of building stronger revenue systems has only intensified. Many developing economies are facing rising debt vulnerabilities, shrinking fiscal space, and declining external support. Indeed, Official Development Assistance to low-income developing countries (LIDCs) has fallen in recent years, while net inflows from private and bilateral creditors have weakened. High public debt ratios and rising associated debt service costs are adding to the pressures from essential spending on health, education, and infrastructure. Strengthening domestic revenue mobilization (DRM) is therefore indispensable. As underlined in the Compromiso de Sevilla, adopted at the Fourth Financing for Development Conference (June 30–July 3, 2025), there is “a pressing need to ensure that domestic resource mobilization becomes a reliable, sustainable, and equitable source of financing for development” (UN 2025).
In discussions about enhancing tax capacity, 15 percent is a widely cited benchmark for the minimum tax-to-GDP ratio. This target features prominently in international initiatives, including the Compromiso de Sevilla, which states: “We call on development partners to collectively at least double this support to developing countries by 2030. This increase should be targeted at developing countries aiming to increase tax-to-GDP ratios, especially those seeking to increase their ratios to at least 15 percent.” Although the 15 percent threshold is not based on exact science, an empirical literature on tax capacity supports the existence of a “tipping point” beyond which growth tends to accelerate. Although estimates of that tipping point are usually somewhat below 15 percent, it appears that the growth effects occur only if improved tax capacity is sustained and continues beyond that point. Indeed, the persistence of higher tax ratios appears more important than temporarily exceeding them. As such, the 15 percent benchmark emphasized in the Seville declaration serves as a practical and operational target for policy and international support.
This paper explores how developing countries can build tax capacity to achieve the goal of mobilizing revenue beyond the 15 percent threshold. It starts with a short review of the empirical evidence on the 15 percent threshold, drawing on IMF research in Gaspar, Jaramillo, and Wingender (2016a) and Bellon and Warwick (forthcoming), using a novel IMF revenue data set (Mansour and others 2025). It then presents stylized facts on revenue performance and new estimates of countries’ tax potential and tax gaps—following Benitez and others (2023)—which highlights both the scale of the global challenge and the opportunities for countries to achieve a revenue ratio that exceeds 15 percent. The paper then examines policy and administrative reforms to strengthen tax capacity, applying a “tax systems approach” that underscores the complementarities between tax policy, the legal framework, and revenue administration. The discussion is anchored in core principles of good taxation and aims to provide evidence-based insights to guide countries’ efforts in mobilizing reliable and equitable revenues for development. The paper complements two IMF reports to the G20, “Alternative Options for Revenue Mobilization” (IMF 2024a) and “Enhancing Domestic Revenue Mobilization through Strengthening Tax Administration” (IMF 2025b). These papers go deeper into some specific aspects of tax design and revenue administration but are less focused on the specific challenges of countries below 15 percent.
Why 15 Percent Matters
This section discusses the empirical base for achieving a tax-to-GDP ratio in a sustained manner of at least 15 percent of GDP—as enshrined in the Compromiso de Sevilla—to support growth and development. It also shows that such tax capacity building should be part of a broader development strategy. The section forms the starting point for further analysis in the paper on how to achieve this objective.
Tax capacity is a cornerstone of state capacity, which in turn underpins private sector development and broader economic growth. The intellectual roots of this perspective can be traced to Joseph Schumpeter more than a century ago, most notably in The Theory of Economic Development (1911) and The Crisis of the Tax State (1918). In the latter, Schumpeter argued that the modern state is fundamentally a “tax state”: taxation both defines and enables the state, making it the primary source of state capacity. In the former, he emphasized that economic progress originates with entrepreneurial innovation, which requires access to resources and finance. These ideas converge in the complementarities between the public and private sectors. The state derives revenues from private economic activity, thereby sharing in national prosperity, while the private sector benefits from the state’s provision of essential public goods—ranging from security, property rights, and justice, to infrastructure, health, and education. Importantly, the state also plays a central role in financial development and stability. A broad-based and credible tax system underpins investor confidence in public debt, positioning the state as a guarantor of financial stability and development. Economic success therefore rests on nurturing this symbiotic relationship between public and private sectors, whereas breakdowns in trust and cooperation risk giving way to conflict and stagnation.
A growing body of research suggests the existence of a threshold in taxation beyond which countries can escape a “low-tax, low-growth trap” and transition to a “high-tax, high-growth path.” Although a stylized narrative, it highlights that taxation is about more than revenue. When broadly accepted by citizens, taxation is closely linked to good governance, legal certainty, effective provision of public goods, and sustained prosperity. The challenge for empirical analysis lies in the fact that taxation and growth are deeply embedded in complex social, political, financial, and economic dynamics, where many variables evolve together. As Card Mas, and Rothstein (2008) show, such environments can generate multiple equilibria, with outcomes shaped by perceptions, beliefs, and expectations. In these settings, small changes in certain variables may trigger large shifts elsewhere. Building on this insight, Gaspar, Jaramillo, and Wingender (2016b) proposed that a tipping point exists in the tax-to-GDP ratio beyond which long-term growth rises sharply. Using a regression discontinuity design and historical data (1800–1980 for 30 countries and 1965–2011 for 139 countries), they identified such a threshold and documented a persistent growth acceleration once it was crossed. These findings have since been replicated and extended with more recent data by Choudhary, Ruch, and Skrok (2024) and Bellon and Warwick (forthcoming), reinforcing the evidence for a tax-to-GDP tipping point.2
Strong institutions are critical for building tax capacity and sustaining growth. Besley and Persson (2011, 2014) highlighted the broader concept of state capacity, encompassing the wide range of capabilities required for effective governance. Building on this idea, Gaspar, Jaramillo, and Wingender (2016a) examined four case studies—China, Colombia, Nigeria, and Spain—and showed how improvements in tax capacity can catalyze broader state capacity development. Their analysis emphasized the importance of political conditions, including robust institutions, inclusive politics, and credible leadership.
Crossing the tax-to-GDP tipping point is associated with not only stronger growth but also institutional improvements. Bellon and Warwick (forthcoming) compare countries that successfully crossed the tipping point (“crossers”) with similar countries that did not (“non-crossers”), using a difference-in-difference framework. They find that GDP per capita in crossers rises significantly faster than in non-crossers, with GDP increasing by about an additional 10 percentage points after a decade. In addition, crossers exhibit meaningful improvements in government effectiveness and financial development relative to their peers.
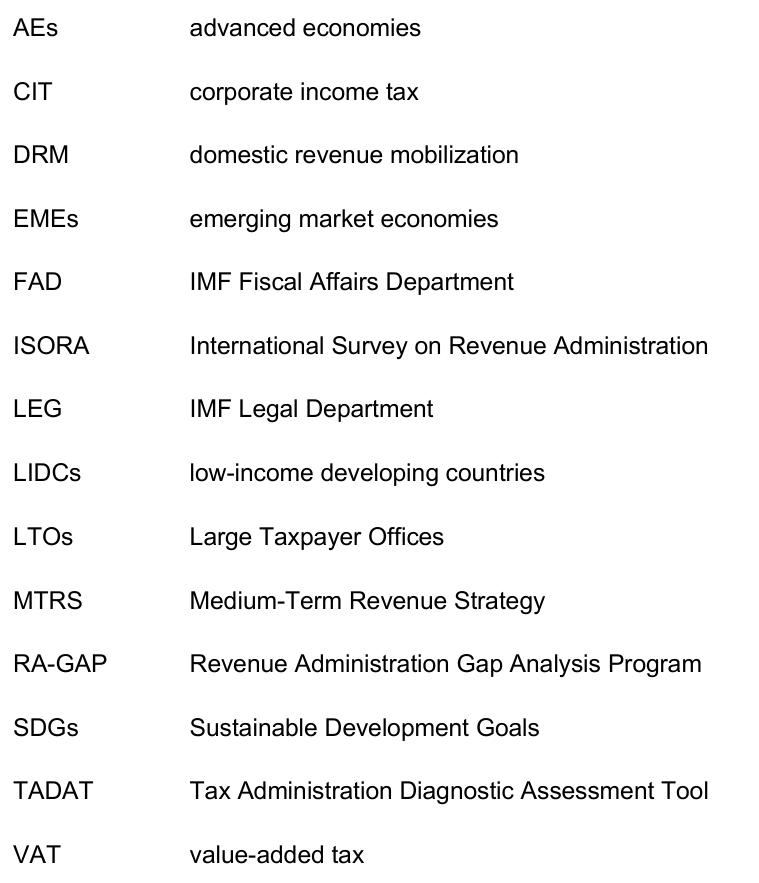
Sustained progress beyond the tipping point is essential. Bellon and Warwick (forthcoming) distinguish between “long-haulers”—countries that continued to build tax capacity after surpassing the tipping point—and “bouncers,” which subsequently slipped back below it. Before reaching the threshold, both groups display similar tax ratios (about 8 percent of GDP) and cross the tipping point within three years (Figure 1). The divergence occurs afterward: long-haulers continue to raise tax revenues, typically reaching 13–16 percent of GDP within a decade, while bouncers stagnate. The growth effects mirror this pattern: long-haulers achieve per capita income growth 16 percent higher than non-crossers over 10 years, whereas bouncers show little difference from countries that never crossed at all (Figure 2). These findings underscore that temporary or unstable increases in tax capacity yield no durable benefits; only sustained progress secures the transition from a low-growth trap to a high-growth path.
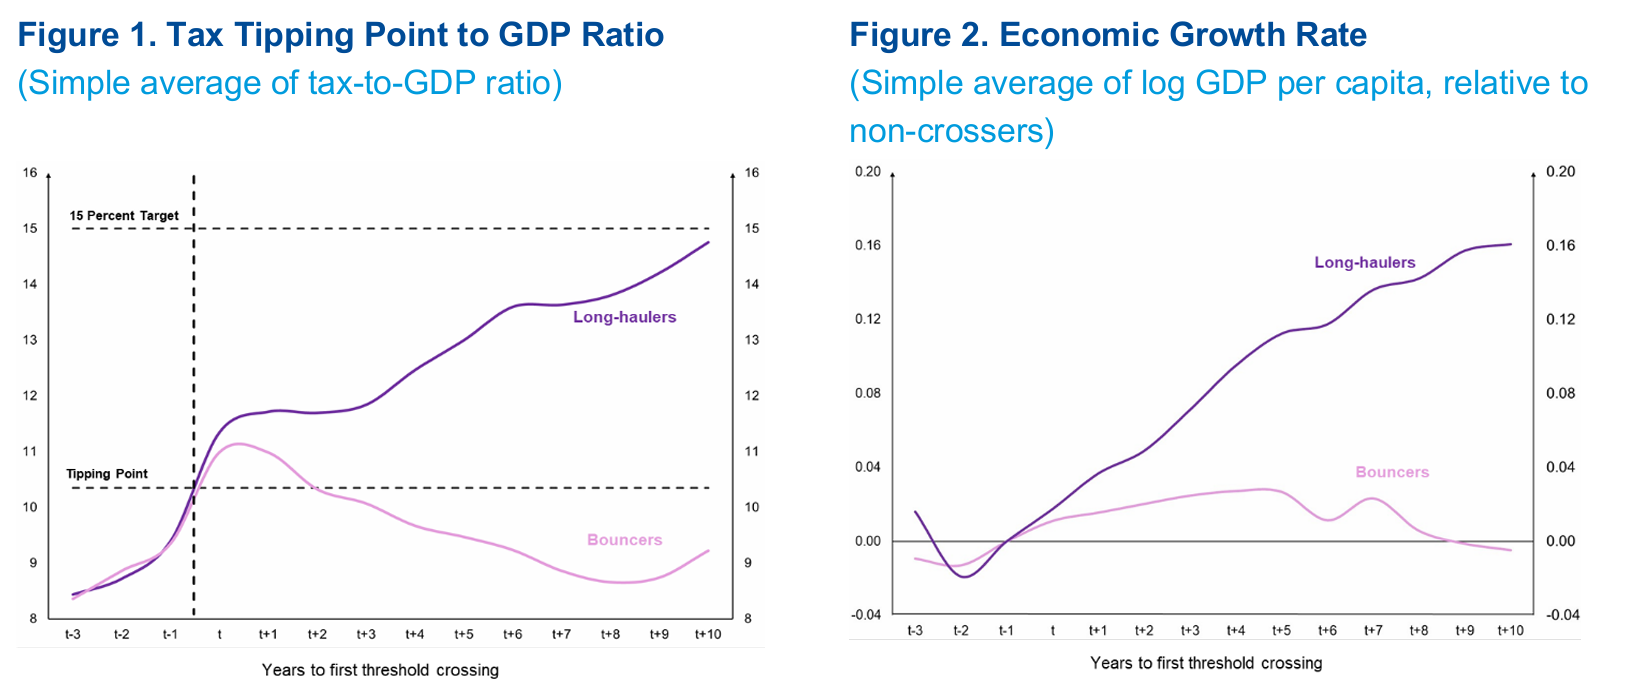
Evidence suggests that the growth gains from strengthening tax capacity come from better public governance and more effective public expenditure. Bellon and Warwick (forthcoming) shows that only long haulers experience improvements in government effectiveness and financial development (Figure 3) and that they use the additional revenue to increase public investment, unlike bouncers. Hence, long-haulers’ sustained revenue mobilization and accelerated growth gains are crucially associated with the effective use of additional revenue, implying that their growth increases because they spend more and better, enabling a greater delivery of public goods and investments to strengthen other institutional capacity. Further, effective delivery of public goods may be important for tax morale and compliance, thereby supporting sustained revenue mobilization and a virtuous cycle of development. This result is in line with the findings of IMF October 2025 Fiscal Monitor (IMF 2025a), which shows how enhancing spending efficiency and reallocating resources strategically can improve growth prospects without increasing overall spending.
Enhancing tax capacity also fosters domestic public bond market development, which is central to deepening financial markets and expanding private sector access to finance. In this regard, the role of the state extends beyond revenue mobilization. Brollo (forthcoming ) examined the relationship between tax capacity and domestic government bond markets across 12 advanced and 17 developing economies during 1990–2020. Her findings indicate a strong and statistically significant link, particularly in developing economies: a one standard deviation increase in the tax-to-GDP ratio is associated with an increase of nearly 14 percentage points in the ratio of domestic public securities to GDP. This relationship remains robust after controlling for other drivers of financial development identified in the literature. Brollo’s research thus provides further evidence of the link between taxation and financial development, even without reference to a tipping point.
Source: Inspired by Bellon and Warwick, forthcoming.
Note: Figures 1 and 2 focus on “crossers,” namely countries that increase their tax-to-GDP ratio above the 10.3 precent tax threshold in the data set during 1965–2019. t indicates the year the country crossed the tipping point threshold for the first time. The figures show the evolution of tax-to-GDP ratios and log GDP per capita in the three years before the first observed crossing of the threshold, and in the following 10 years. The figures split crossers into two groups of equal sizes between “bouncers” and “long-haulers,” depending on how often the tax ratio remains above the threshold in the years after crossing.
Source: Bellon and Warwick, forthcoming.
Note: Panels 1 and 2 cover the same countries depicted in Figure 1 and 2, indicating the year the country crossed the tipping point threshold for the first time. The analysis was conducted using the Financial Development Index from Svirydzenka (2016) and the Government Effectiveness index from the World Bank World Governance Indicators (Kaufman and Kraay 2024). The two indexes are normalized to have a mean of 0 and standard deviation of 1.
These findings underscore the importance of countries raising their tax-to-GDP ratios in a sustained manner to at least 15 percent of GDP, as part of a broader development strategy. The Compromiso de Sevilla explicitly enshrines this target. Yet the 15 percent benchmark should not be pursued in isolation. On the one hand, tax systems must be of high quality—designed to minimize distortions, support growth, and maintain legitimacy by being perceived as fair and understandable. On the other hand, durable tax capacity building must go hand-in-hand with broader institutional and economic development, including sound governance and deepening financial markets. Only within such a comprehensive framework can higher tax ratios translate into sustainable development and enable lasting economic take-off.
The Size of the Global Challenge
This section discusses revenue performance of developing countries, using the IMF World Revenue Longitudinal Database (WoRLD) database (Mansour and others 2025). It elaborates on trends in revenue, identifies countries with a tax-to-GDP ratio below 15 percent, and estimates the tax potential for countries, reflecting the ability to achieve a tax ratio exceeding 15 percent through tax system reform. The section also looks at the pattern of revenue growth in countries that have achieved sustained revenue gains in the past.
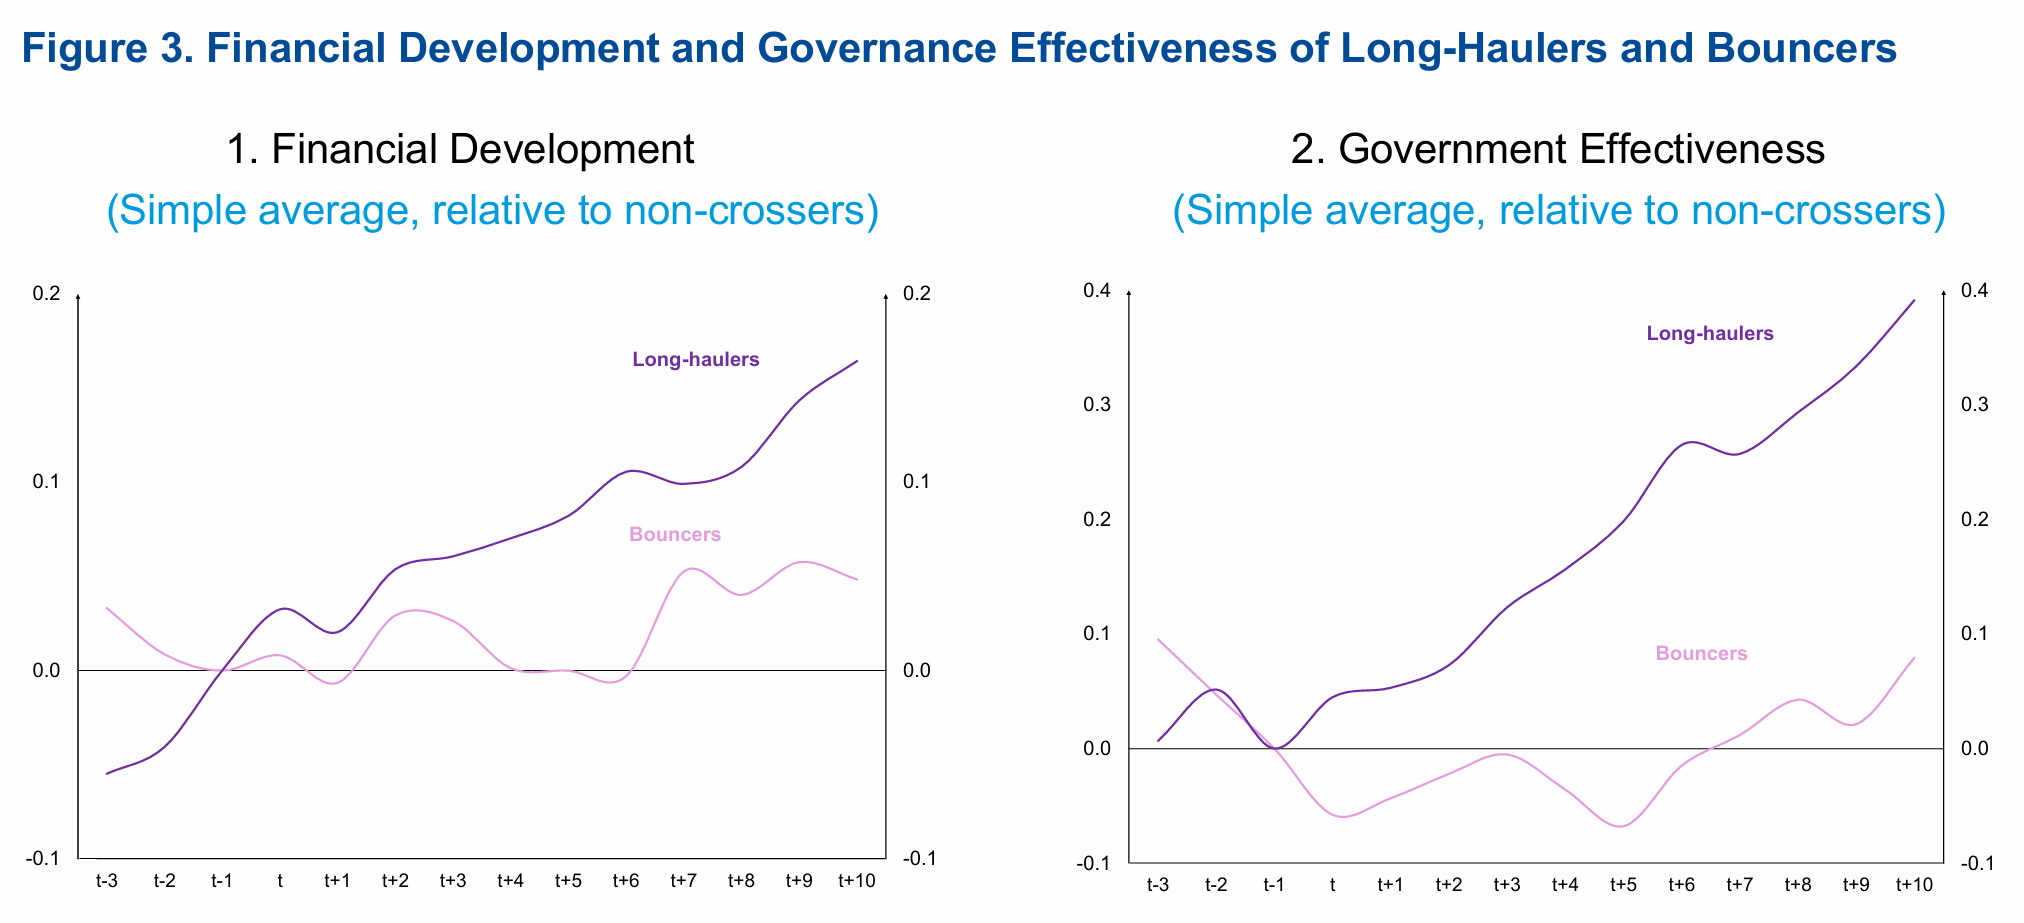
Total revenue and tax revenue. Figure 4 presents the evolution of government revenue in LIDCs, emerging market economies (EMEs), and advanced economies (AEs). Total revenues (Figure 4, panel 1) were approximately 29 percent of GDP in EMEs and 25 percent in LIDCs in 2022. These levels are somewhat higher than in 1995 but have remained relatively stable since 2010, as most of the increase occurred during the first decade of the 21st century. Tax revenues (Figure 4, panel 2, excluding social security contributions) constitute the primary source of budgetary funds across all country groups, accounting for nearly two-thirds of total revenues in AEs and slightly more than 50 percent in both EMEs and LIDCs. Tax revenue ratios increased between the early 2000s and 2010 but have since stabilized. Notably, the average tax-to-GDP ratio in LIDCs remains below 15 percent. Non-tax revenues comprise economic rents from nonrenewable and renewable natural resources (including oil and gas, mining, forestry, and fishing), grants, social security contributions, and various fees and other levies.
Sources: IMF 2025 and Mansour and others 2025.
Note: Simple averages across countries.
An important factor in shaping tax levels is resource wealth.3 To illustrate this finding, the figures presented in this section will distinguish between two groups of LIDCs and EMEs: (1) resource-rich LIDCs and EMEs, defined as those with an average ratio of natural resource rents above 9 percent of GDP 4 and (2) non-resource rich LIDCs and EMEs.5 Among the resource-rich developing countries, Figure 5 shows that tax revenue has remained broadly stable and low, at about 8 percent of GDP, since the early 1990s. For these countries, non-tax resource revenue constitutes an important source of government funds, although it has declined somewhat since the early 2000s. In contrast, non-resource-rich developing countries have experienced an increase in tax revenues of approximately 2 percentage points of GDP, primarily driven by growing contributions from taxes on sales and production. Non-tax revenues in this group mainly consist of grants, which may face increasing constraints in the near future due to declining official development assistance.
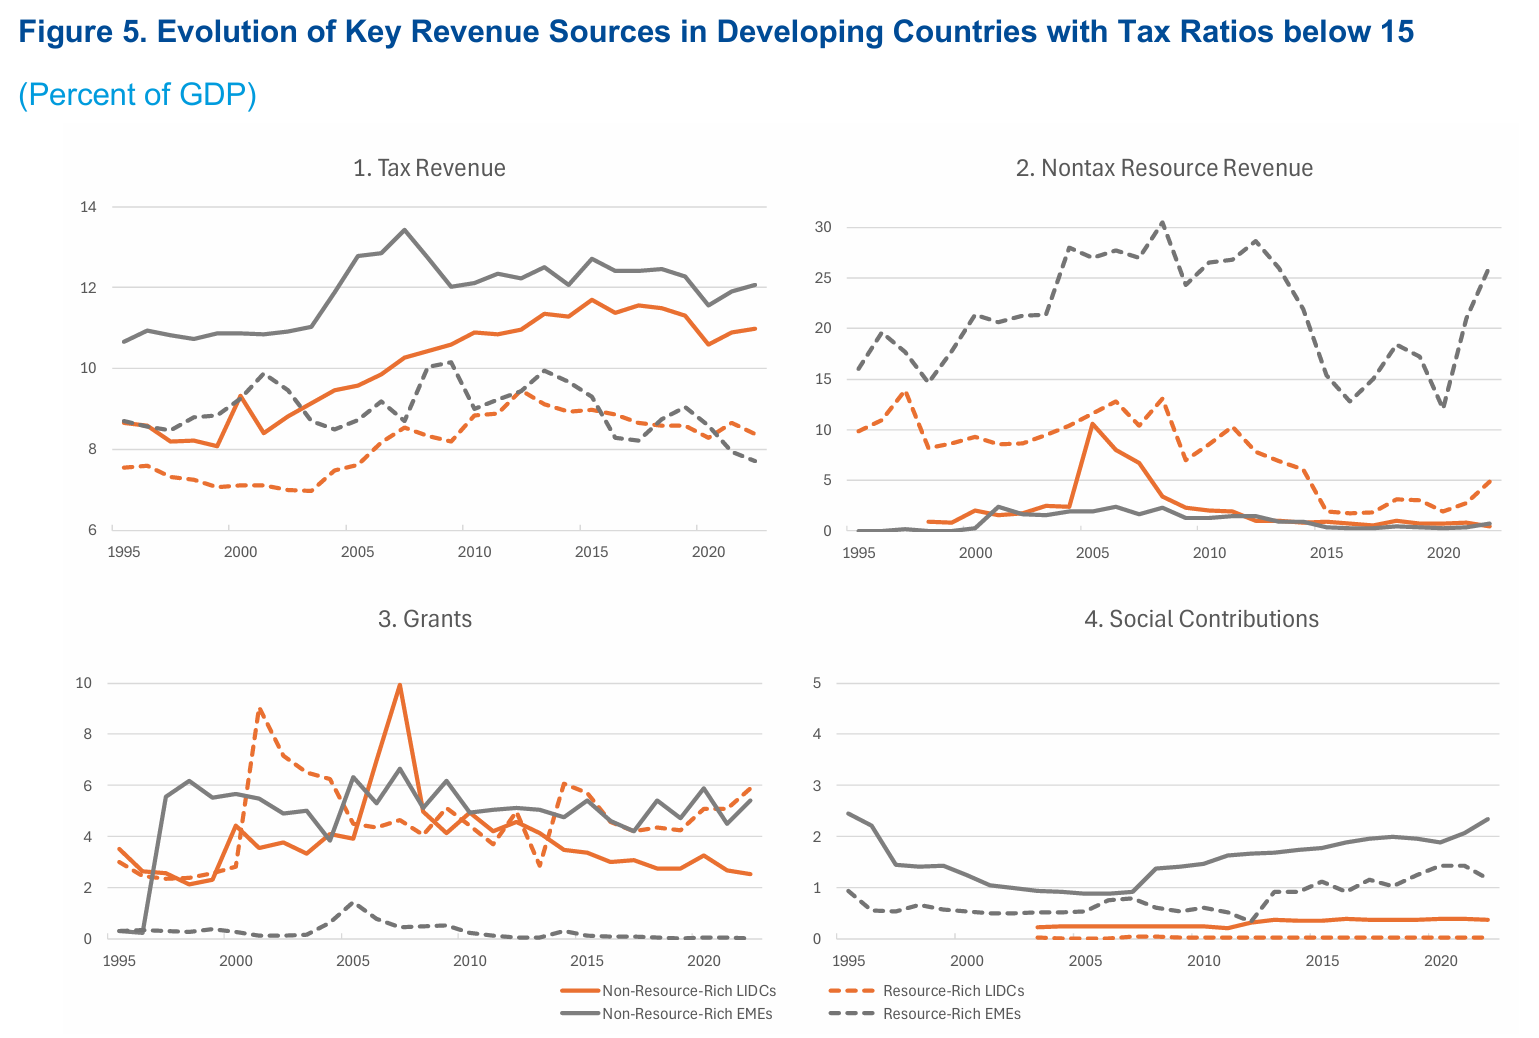
Sources: Authors, based on IMF 2025 and Mansour and others (2025).
Note: Figures show simple averages across country groups. The group of resource-rich countries is built using natural resource rents from the World Bank World Development Indicators, with the 75th percentile, that is, 9 percent of GDP, serving as the benchmark to identify those with significant resource endowments. Resource-rich countries are therefore defined as countries with an average ratio of natural resource rents to GDP over the period above 9 percent of GDP. The sample includes countries with a tax-to-GDP ratio below 15 percent (see Annex 3). The observed spike in nontax resource revenue in 2006 in panel 2 is driven by a large increase in oil related revenue in São Tomé and Principe and Sudan. In addition, the spike in panel 3 around 2007 for grants in non-resource-rich LIDCs is attributed to the IMF Heavily Indebted Poor Country completion point in some countries, including Niger in 2004 and São Tomé and Príncipe in 2007. In panel 4, Tuvalu has been an outlier for several years and was removed from the sample. EMEs = emerging market economies; LIDCs = low-income developing economies
A large number of countries feature tax-to-GDP ratios below 15 percent. Figure 6 shows the distribution of countries with respect to their tax-to-GDP ratio. The distributions of EMEs and AEs are centered at about 17.5 and 27.5 percent of GDP, respectively, and exhibit significant dispersion. For LIDCs, the distribution of tax-to GDP is tightly centered at about 12.5 percent, with only 18 out of 58 countries collecting more than 15 percent. In FCSs LIDCs, the distribution of their tax-to-GDP is centered at about 10 percent, with only 6 out of 26 countries collecting more than 15 percent of GDP. Notably, among the 20 FCSs LIDCs with a tax-to-GDP ratio below 15 percent, 13 are resource-rich.
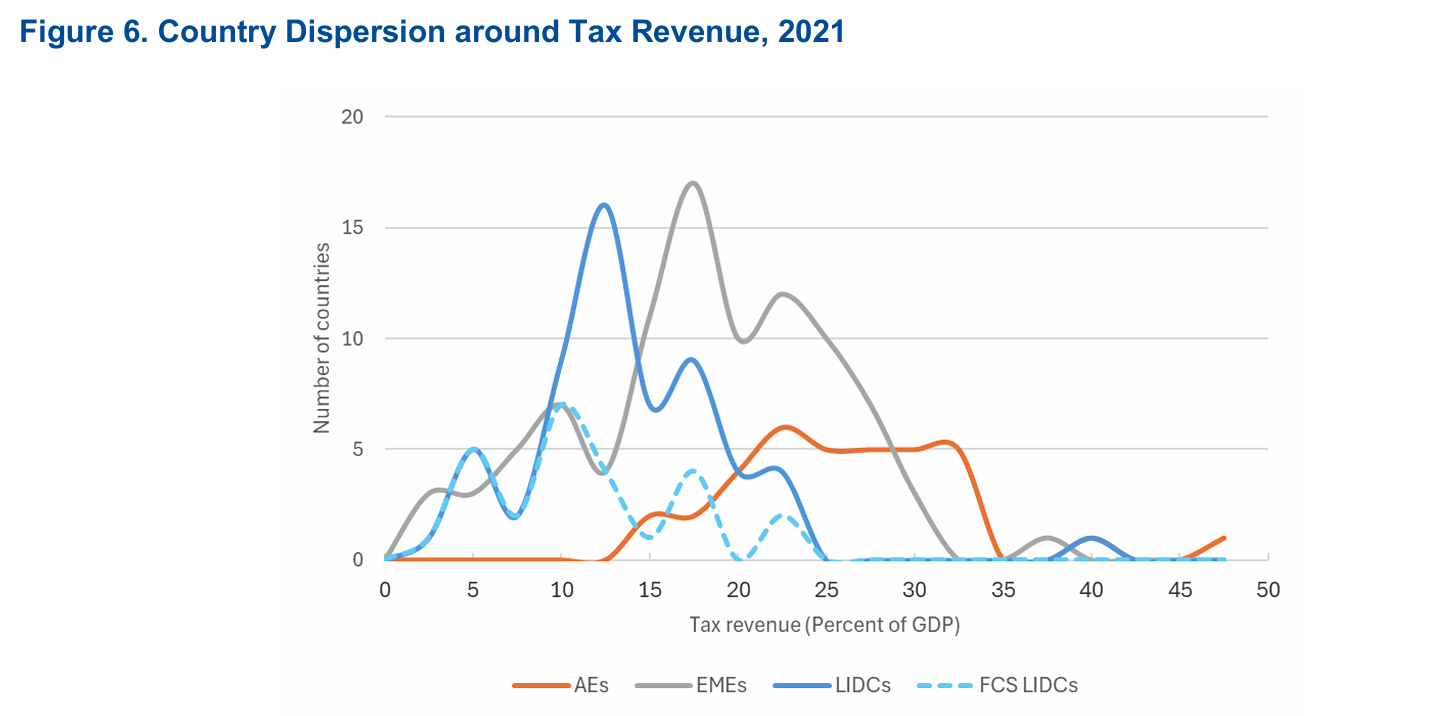
Sources: Authors based on IMF 2025 and Mansour and others (2025)
Note: The data cover 2021 and exclude social contributions. Figures are simple averages across countries. Countries with a tax-to-GDP ratio below 10 percent are either fragile and conflict-affected or resource-rich with ample non-tax revenue. AEs = advanced economies; EMEs = emerging market economies; FCS = fragile and conflict-affected state; LIDCs = low-income developing economies
Estimating tax potential. The key question for DRM is how much additional tax revenue countries can reasonably mobilize, especially those below the 15 percent threshold. This figure can be inferred from estimates of tax potential, defined as the estimated maximum possible level of tax revenue in a country, given its conditions in terms of income per capita, economic structure, openness to trade, and institutions.6 By deducting actual revenue collection levels from this estimated potential, the authors obtain the so-called tax gap, that is, the remaining space for tax revenue mobilization through reform of policy and administration (Figure 7). The baseline model estimates a tax potential in LIDCs and EMEs of, respectively, 17.7 and 21.5 percent of GDP. Compared to actual tax ratios, this implies a tax gap of about 5 percent of GDP for both groups. However, when the authors control for natural resource rents,7 the tax potential drops slightly to 17.3 of GDP in LIDCs and 21.3 percent in EMEs. This confirms the importance of resource wealth for tax revenue mobilization but also highlights that the results of tax potential and tax gap are highly sensitive to the selected specification as noted in Mansour and others (2025).8
Increasing tax potential. Figure 8 shows the estimated tax potential and tax gaps for countries with tax ratios below 15 percent. Many countries in this group have a tax potential between 15 and 20 percent, thus indicating a feasible path for passing the revenue threshold of 15 percent through reform of the tax system. However, some countries feature an estimated tax potential that is well below 15 percent. For them, mobilizing tax revenue will be more challenging through reforms of tax policy and administration. Instead, improving institutions might be the key priority to improve the tax potential itself. For instance, following the approach in Benitez and others (2023), Figure 7 shows how tax potential would rise if the quality of public institutions in LIDCs—in general, not just tax institutions—is improved to mimic the level in EMEs (and that of EMEs to mimic the level of AEs). The results suggest that this could raise an additional revenue of 1.2 percent of GDP for LIDCs and 0.5 percent of GDP for EMEs. In the specification with natural resource rents, the additional revenue is estimated at 2.0 and 0.8 percent of GDP for these respective groups.
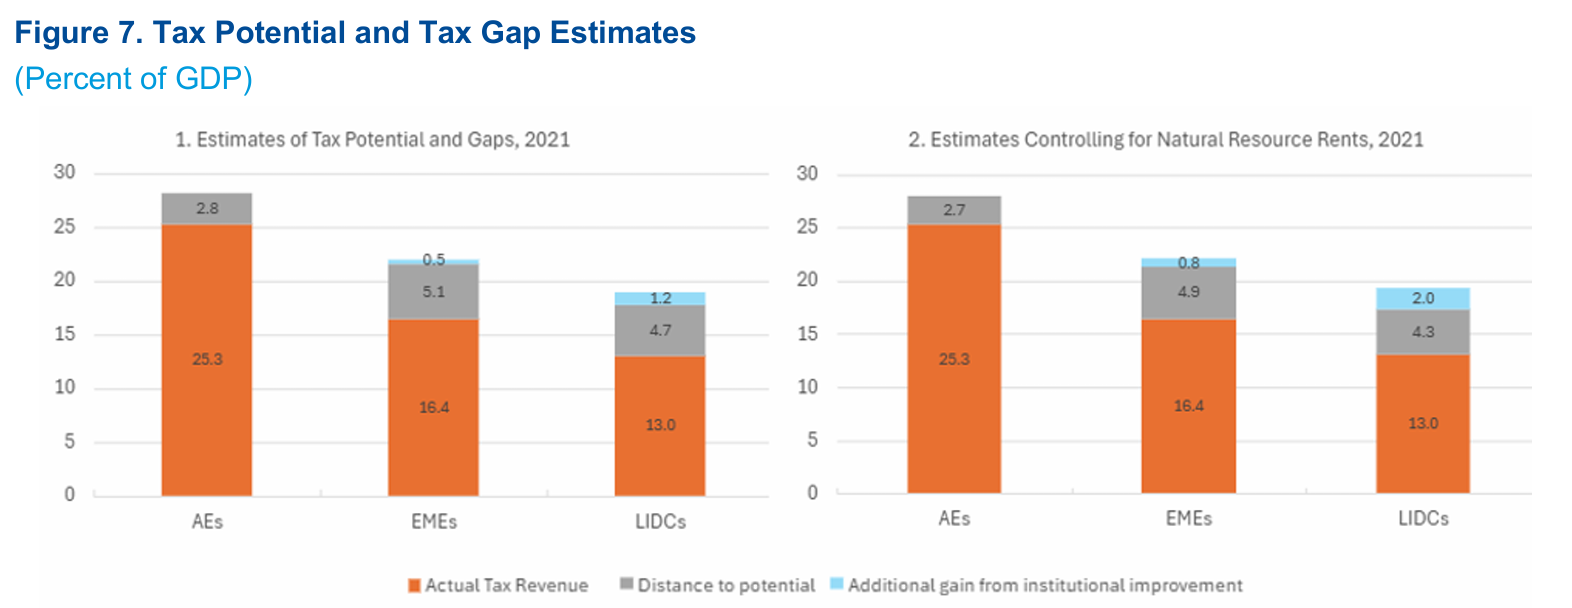
Sources: Benitez and others 2023; Mansour and others 2025; and IMF staff estimates using IMF 2025.
Note: The panels in the figure show simple averages across county groups. The grey area denotes the tax gap, the difference between potential and actual taxes. The additional gain from institutional improvement (blue area) is obtained using a different econometric specification wherein actual values for low-income developing countries (LIDCs) are replaced by values for emerging market economies (EMEs) and actual values for EMEs are replaced by values for advanced economies (AEs). All estimates are for 2021. Annual estimates of tax potential vary; the average gaps over 2017–21 were as follows: under the base line model (panel 1) 4.9 percent of GDP for LIDCs, 4.6 percent for EMEs, and 3 percent for AEs; under the control for natural resources rent model (panel 2), 4.5 percent of GDP for LIDCs and EMEs, and 2.9 percent for AEs.
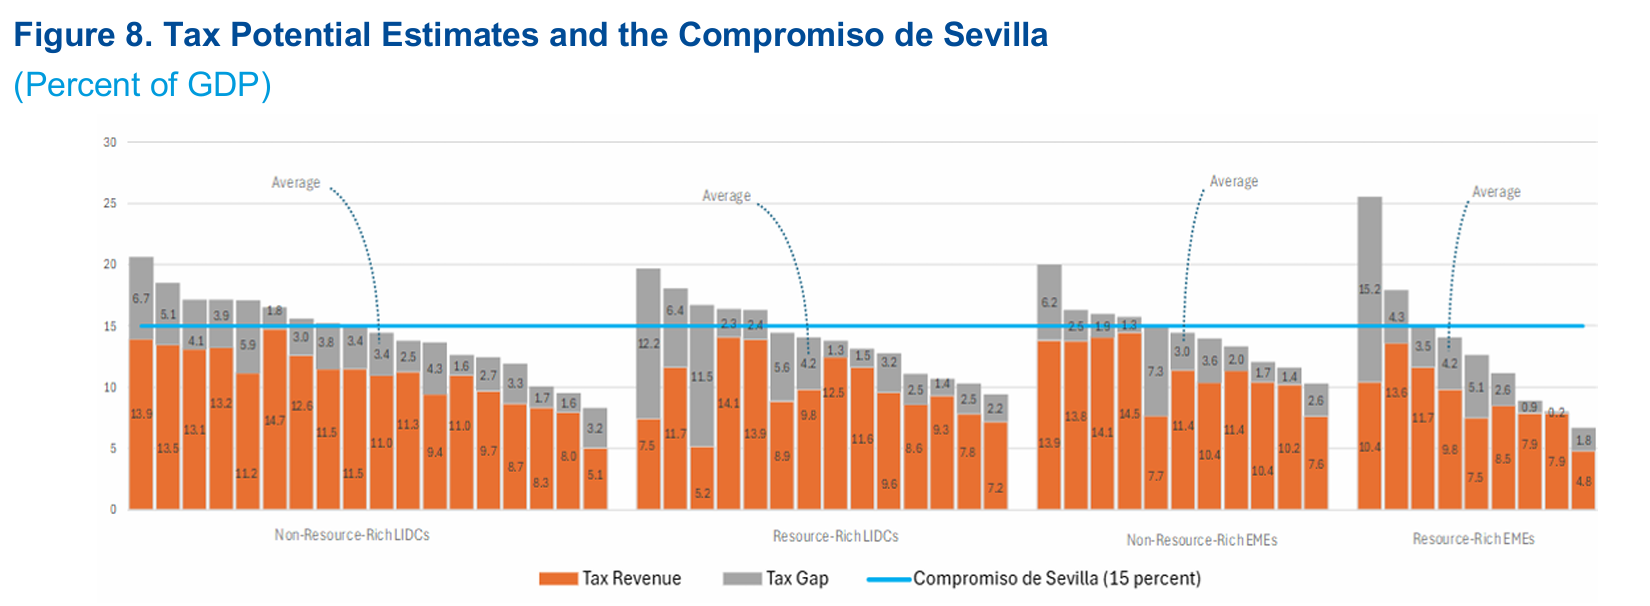
Sources: Benitez and others 2023; Mansour and others 2025; and IMF staff estimates using IMF 2025c.
Note: The distance to potential is based on Mansour and others (2025) and Benitez and others (2023). Actual tax revenue is for 2022. Countries without data for 2022 are excluded. The estimated distance to potential is the average estimated value over 2020–22. The group of resource-rich countries is built using natural resource rents from the World Bank World Development Indicators, with the 75th percentile, that is, 9 percent of GDP, serving as the benchmark to identify those with significant resource endowments. Resource-rich countries are therefore defined as countries with an average ratio of natural resource rents over the period above 9 percent of GDP. The sample includes countries with a tax-to-GDP ratio below 15 percent (see Annex 3). EMEs = emerging market economies; LIDCs = low-income developing economies
Countries with large revenue gains have managed to sustain tax increases over extensive episodes. The authors look at the experience of countries that have managed to achieve a sustained increase in revenue. Figure 9 indicates a positive association between the number of episodes of sustained tax increases and the magnitude of the cumulative revenue gain. An episode of tax increase (or tax loss) is defined here as a period of at least three consecutive years of increase (decrease). Figure 9 shows that most countries with a sustained revenue gain experience one, two, or three episodes of increase; countries with a sustained loss mostly experience one or two periods of decline. For countries that gain, the median cumulative gain in tax revenue rises markedly with the number of episodes, from less than 2 percent of GDP for those with occasional revenue increases to more than 6 percent for those with four episodes of increase. The variability in the gain narrows with the larger number of episodes. These findings underscore the importance of structuring tax reform as a process, rather than a one-off intervention. Among countries with tax revenue declines, those with zero episodes of decline tend to exhibit the highest and most volatile losses. This finding suggests that erratic tax revenue collapses result in the most severe losses. In contrast, countries with one episode of sustained underperformance show the smallest median tax revenue loss of about 2 percent of GDP with a small dispersion.
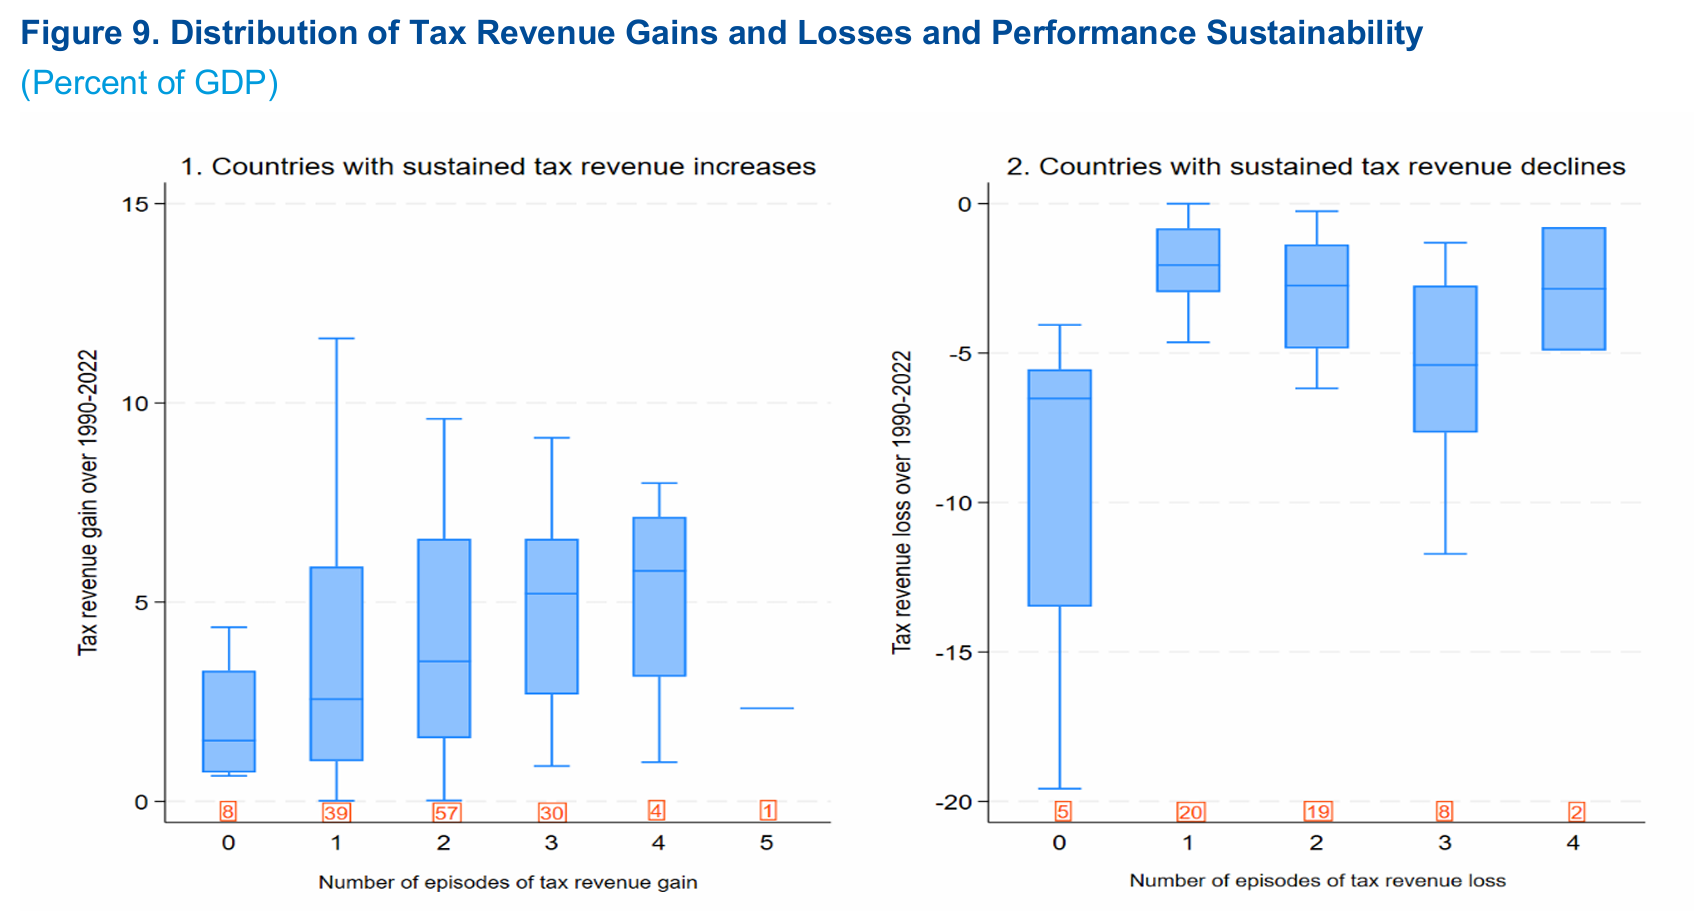
Sources: IMF staff, based on IMF 2025c and Mansour and others 2025.
Note: Outlier values are omitted. Episodes of gains (losses) are defined as consecutive increases (declines) in tax revenue-to-GDP for at least three years during 1990–2022. The number of countries by number of episodes is presented in red boxes on the x axis. Countries are classified either in the increasing or declining groups, such that a country cannot be included in both groups. Annex 1 and 2 provide further information on countries with gains and losses during 1990–2022.
Click to read more