Highlights
We present a comprehensive analysis of EU member states’ long-term mitigation policies.
EU mitigation efforts rely on (energy) efficiency measures as primary mitigation lever.
(Energy) demand reduction strategies play a minor role in proposed mitigation policies.
The EU’s policy instrument mix is dominated by economic and regulatory instruments.
EU mitigation efforts failing to leverage the full spectrum of available strategies and instruments.
Abstract
Despite ambitious EU targets, national emission trajectories reported by member states continue to fall short of achieving the necessary reductions. This implementation gap raises the question of what mitigation strategies and instruments member states rely on to meet internationally binding climate targets. To explore this, we scrutinise 1584 implemented, adopted, or planned mitigation policies across the sectors of agriculture, transport, energy consumption, and industry using qualitative content analyses. Our findings reveal substantial discrepancies in the distribution of mitigation strategies. Efficiency improvements dominate EU mitigation efforts, comprising 54 % of proposed measures. In contrast, policies promoting shifts to low-carbon alternatives represent only 14 %, while those avoiding energy or service demand make up just 2 %. Even when considering broader policy mixes that include elements of shifting and reducing final demand, these strategies remain under-represented across all sectors, particularly in industry and agriculture. The remaining share of reported mitigation policies, accounting for 21 %, focus on altering broader regulatory frameworks and incentive structures, underscoring their critical role in EU member states' mitigation efforts. Additionally, we find member states to rely predominantly on economic and regulatory policy instruments, with substantial variation across mitigation strategies and sectors. Our findings carry important policy implications, unveiling EU’s reliance on efficiency-centred approaches to achieve climate targets. Given the implementation gap and the untapped potential of demand-side measures, diversifying mitigation strategies could enhance the EU’s ability to meet legally binding climate targets.
1. Introduction
Despite mounting evidence and wide-spread warnings of potentially catastrophic impacts of climate change since the 1990s, governments have not succeeded in bending the emissions curve (Stoddard et al., 2021; IPCC et al., 2023). Instead, global emissions still rise across all major sectors and national reduction pledges lag behind the Paris agreement, suggesting a global average temperature increase of up to 2.8 °C above pre-industrial levels by the end of this century (UNEP, 2024). In the case of the European Union (EU), annual GHG emissions continue to decline, yet current trajectories remain off track to meet its self-imposed targets of reducing net greenhouse gas emissions by 55 % in 2030 (relative to 1990 levels) and climate neutrality by 2050 (EEA, 2023a; European Commission, 2024a). At the same time, the European Commission proposed the implementation of a new ambitious 2040 target of net 90 % emission reduction from 1990 levels (European Commission, 2024b). This points towards a widening implementation gap (Fransen et al., 2023; IPCC et al., 2023) between, on the one hand, EU level target setting, and, on the other hand, member states failing to deliver the emission reductions required to meet climate goals (European Commission, 2023b). On a national level, the question of how countries translate climate pledges into laws, measures, or plans and what types of policies and instruments are best suited to deliver emission reductions remains highly contested (Perino et al., 2022; Stechemesser et al., 2024; Baker et al., 2025). Economists have long argued that achieving an ‘economic first-best approach’ requires a uniform carbon price across all sectors (Rezai and van der Ploeg, 2017). For such an approach to be effective, however, the carbon price (€/tCO2) would need to rise substantially (Edenhofer et al., 2021; Rennert et al., 2022).1 If carbon prices remain below this necessary threshold, “remaining abatement requires stringent complementary policies” (Abrell et al., 2024, p. 2). Given that estimated carbon prices reported by EU agencies remain considerably lower than those suggested in the literature (Abrell et al., 2024), effectively addressing the implementation gap necessitates taking stock of what policies and instruments EU mitigation efforts are primarily based upon.
Recent evidence suggests current mitigation modelling (Solano Rodriguez et al., 2017; Duscha et al., 2019) and policy making are skewed towards “[…] supply-side technology solutions […]” (Creutzig et al., 2018, p. 260). Despite the potentials of such approaches to contribute to climate change mitigation (Ürge-Vorsatz and Metz, 2009; Zimmermann, 2022), a growing body of literature suggests such predominantly technology-based approaches to be insufficient for achieving the emission reductions required for staying within a 1.5 °C trajectory (Samadi et al., 2017; Barrett et al., 2022; Cordroch et al., 2022). This is corroborated by IPCC scenarios highlighting that the sole reliance on technical measures requires vast amounts of carbon to be removed from the atmosphere (Cordroch et al., 2022; IPCC et al., 2022), with a growing body of literature expressing biophysical and economic scalability concerns with regard to negative emission technologies (Smith et al., 2016; Beck and Mahony, 2018; Lenzi et al., 2018). Against this background, it becomes a prerequisite to mobilise additional strategies beyond technology-centred silver bullet approaches (Warszawski et al., 2021) to avert “Hothouse Earth” (Schröder and Storm, 2020).
This, for the first time, is acknowledged by the IPCC with the inclusion of a chapter on demand-side mitigation, aiming not only at harvesting potential efficiencies in end-user service delivery, but at shifting and reducing final demand (Creutzig et al., 2022b). Such end-use sector mitigation potentials can be classified according to the Avoid-Shift-Improve (A-S-I) framework. Originated in transport studies (Section 2.1), the framework highlights the importance of demand reduction (i.e. avoid) and alternative mode choice (i.e. shift) over efficiency improvements (i.e. improve) in mitigating transport emissions (Dalkmann and Brannigan, 2007; Creutzig et al., 2018). However, with an estimated global mitigation potential of avoid and shift strategies of approximately 32 % (13–54 %) by 2050 compared to a business-as-usual scenario (Creutzig et al., 2022a), strategies aimed at reducing of shifting the end-use of goods and services represent a significant mitigation lever beyond the transport sector.
But is the EU able to mobilise the full range of options available to meet its mitigation commitments? An analysis of short-term National Energy and Climate Plans (NECPs)2 and Long-Term Strategies (LTS)3 of EU member states suggests strategies that promote energy demand reduction to numerically play only a marginal role (Zell-Ziegler et al., 2021), despite their high approval rates at European citizen assemblies (Lage et al., 2023). In contrast, Jarre et al. (2024) indicate that demand reduction strategies, alongside a shift to low-carbon energy carriers and efficiency improvements, numerically constitute a fundamental component within energy policy databases and, consequently, mitigation efforts. However, to date, no detailed analysis of the comprehensive set of policies integrated in EU long-term emission scenarios was conducted. To address this gap, we scrutinise the following research question: What is the prevalence of avoid, shift and improve strategies in European long-term mitigation trajectories in the end-use sectors of transport, industrial processes, energy consumption and agriculture? We thereby contribute to existing literature threefold. First, addressing the science-policy interface, we bridge current theoretical debates on demand-side mitigation and policymaking by delivering empirical evidence on EU mitigation policy preferences. Second, by analysing a total of 1584 policies and measures4 (PaMs) reported in emission scenarios across 27 EU member states as well as Iceland, Norway and Switzerland, we unveil weak points of European mitigation efforts by outlining discrepancies in the distribution of mitigation strategies, thereby informing decision-makers about potentials for policy development and improvement. Third, we provide a detailed breakdown of sector-specific approaches and highlight preferred policy instruments. This enhances our understanding of the EU’s decarbonisation approach, enabling the identification of specific target areas for diversifying mitigation efforts.
2. Concepts and methods
2.1. The Avoid-Shift-Improve framework
Originating in the early 1990s, the framework was developed to break down four key components driving GHG emissions in the transport sector: Activity levels (e.g., passenger-kilometres), modal Structure (share by mode), energy Intensities (energy per kilometre), and Fuel carbon intensity – the Activity-Structure-Intensity-Fuel (A-S-I-F) model (Schipper and Marie-Lilliu, 1999). At a time of rapid growth in motorisation levels, transportation needs and resulting accelerating environmental consequences, A-S-I-F was first popularised in 2013 as part of the Bogota Declaration on Sustainable Transport (Dalkmann and Brannigan, 2007). Targeting the A-S-I-F drivers, three overarching strategies emerged: (a) avoiding mobility needs or shorten trip length to reduce overall activity levels (e.g. teleworking, improved urban planning, etc.); (b) shifting demand towards more efficient and less emission-intensive modes of transport (e.g. active mobility, public transport); and (c) improving energy-efficiency of vehicles and developing less emission-intensive fuels (Dalkmann and Brannigan, 2007; Creutzig et al., 2018). Note that the switch to low or zero-carbon fuels has been condensed into the improve category, reducing A-S-I-F to the widely used A-S-I framework (GIZ, 2014).
A-S-I remains to be a commonly used framework for researching transport decarbonisation pathways (Arnz and Krumm, 2023; Zhu et al., 2023; e.g. Arnz et al., 2024; Wan et al., 2025). Recent applications, however, have expanded its application to the industry sector (Sharmina et al., 2021) and the energy system (Pye et al., 2021; Jarre et al., 2024). Most notably, however, A-S-I gained momentum with the rise of demand-side mitigation strategies challenging the dominance of supply-side solutions to climate change mitigation (Creutzig et al., 2018, p. 260). Unlike supply-side approaches that focus on how goods or services are supplied, demand-side measures directly target the reduction of final (energy) demand and end-service levels (Creutzig et al., 2016, 2018; Mundaca et al., 2019; IPCC et al., 2022). Thereby, the A-S-I framework has been crucial for disentangling different strategies to mitigating emissions in end-use sectors (Creutzig et al., 2024). Due to its widespread use and practicality in concrete policy application, the A-S-I framework is well-suited for scrutinising EU mitigation efforts and delivering tangible outcomes for decision-makers.
2.2. Strategy definitions and consistency
As boundaries between mitigation strategies tend to be blurry in practice (Fuchs et al., 2023), it is key to establish a clear delineation. For strategy definitions, we follow Creutzig et al. (2022a), .5 Note that the approach taken slightly deviates from the IPCC’s final service-centred perspective, which classifies shifts in energy carriers in the building, industry and agricultural sector as improvements in existing technologies (Creutzig et al., 2022b). While this is justified on the grounds of such approaches not affecting final service provision, it overlooks the fundamental changes required to rapidly electrify end-use sectors (Deason and Borgeson, 2019; Wei et al., 2019). Additionally, it fails to account for the broader scope adopted by EU member states, which extends beyond end-service delivery to include the production and provision of goods and services.
In addition to avoid, shift and improve strategies, a general category was introduced to capture ambiguous PaMs that influence broader framework conditions and/or constitute a policy mix. This, for instance, applies to PaMs such as green tax reforms and the implementation of the EU’s Common Agricultural Policy. Discrepancies in the granularity of national reporting further contributed to PaMs incorporating multiple strategy types (Section 4.2). To prevent the research design from systemically underreporting shift and avoid measures, we added an additional general (A/S) category to capture PaMs representing policy mixes that explicitly reference a switch to low-carbon alternatives and/or demand reduction. This accounts for the possibility of countries being less inclined to report avoid or shift strategies, particularly those with broader implications for end-users. Instead of being reported as standalone measures, these strategies may be embedded within more comprehensive policy packages in national reporting. We thus distinguish between the following five categories, with a detailed description including exemplary policies being available in Table 1.
i)Avoid (coded as 1): Mitigation strategies that “reduce unnecessary (in the sense of being not required to deliver the desired service output) energy consumption by redesigning service provisioning systems” (Creutzig et al., 2022b, p. 509).
ii)Shift (coded as 2): Mitigation strategies that “describe the switch to already existing competitive low-carbon technologies and service-provisioning systems” (Creutzig et al., 2022a, p. 37).
iii)Improve (coded as 3): Measures that improve energy- and resource-efficiency of existing technologies delivering emission reductions without changing end-use service provision, even though behavioural adoption towards new technologies by end users may be required (e.g. from combustion engines to battery electric vehicles) (Creutzig et al., 2022a).
iv)General (coded as 4): Mitigation options that alter the regulatory framework or incentive structure to promote the reduction of energy consumption or emissions in general (e.g. taxation structure). Strategies could either be avoid, shift or improve (or only two of them). This category furthermore comprises PaMs that remain vague with no clear aim being identifiable (Zell-Ziegler et al., 2021; Lage et al., 2023).
v)General (A/S) (coded as 5): Strategies that alter the regulatory framework or incentive structures to promote the reduction of energy consumption or emissions in general (e.g. taxation structure). In contrast to general, this category comprises policies that contain explicit avoid and/or shift elements.
Table 1. Examples of sectoral PaM coding according to avoid, shift, improve, general and general (A/S).
| Sector | Policy example | Strategy | Explanation of strategy type classification |
| Agriculture | National buy out scheme for livestock farmers for voluntary ending of NH3 intensive farms (#1111) | Avoid | PaM aims at reducing the total number of NH3 intensive livestock farms |
| Change in people's diet (#212); 7-AG-06: Biogas plants (#293); Strategy to promote plant-based protein (#446) | Shift | PaMs aim at shifting from emission-intensive animal-based foods to less emission intensive protein sources or providing renewable energy sources via biogas plants | |
| Agricultural Investment Fund for energy efficiency, renewable energy-precision fertilization and guidance for farmers (#39); MAG-2: Improvement of livestock facilities and manure management systems (#146) | Improve | PaMs aim at improving existing agricultural practices and energy efficiency | |
| Implementation of EU agricultural policies (#17); Strategy for Growth in Agriculture (#224) | General | PaM refers to the implementation of broader framework conditions, with individual strategy applications of avoid, shift and/or improve remaining unclear | |
| Energy consumption | Every kWh matter. Consumption-reducing information campaign. Swedish Energy Agency is carrying out an information campaign to contribute to changed habits and increased knowledge to reduce electricity use (#1555) | Avoid | PaM aims at energy demand reduction |
| Support scheme for the production of electricity from renewable energy sources for own use (#175); Fossil exit for heating (#87) | Shift | PaMs aim at phasing out fossil-based technologies and/or fosters switch to renewables in the heating sector | |
| Thermal Improvement of Building Stock (#8), Energy performance of buildings regulation (#92) | Improve | PaM aims at improving energy efficiency and performance of the buildings stock | |
| Carbon tax on fossil fuels (#715); EU Emission Trading Scheme (ETS) (#7); Energy advice network for citizens (#1354) | General | PaM refers to the implementation of broader framework conditions that could trigger application of avoid, shift and/or improve strategies | |
| Climate Neutral New Buildings (#7); Government-wide Programme for a Circular Economy (RBCE): 'A Circular Economy in the Netherlands by 2050' (#1082) | General (A/S) | PaMs represent a strategy mix that contains avoid and/or shift aspects, such as the switch to renewable energy systems in the building sector or a circular economy approach promoting the reduction and reuse of resources | |
| Industrial processes | Restrictions and prohibitions on placing certain products and equipment on the market (#192) | Avoid | PaM aims at directly limiting the consumption of certain emission- or resource-intensive products |
| Renewable energy systems use in industry (#904); Production and use of hydrogen (#911) | Shift | PAMs aim at shifting towards low-carbon technologies in production processes by promoting the use of renewables or hydrogen | |
| Tax deduction for (Energy Efficiency) investments by companies (#24); Increasing energy efficiency in companies (#920) | Improve | PaMs aim at fostering energy efficiency to lower energy needs per unit of production | |
| State credit guarantees for green investments (#1541); National Competitiveness Strategy 2021–2027 (#1292); | General | PaMs aim at changing broader framework conditions, lack specificity and could incentivise the application of avoid, shift and/or improve strategies | |
| Strategy for Circular Economy 2030 (#1293) | General (A/S) | PaMs represent a strategy mix that contains avoid and/or shift aspects, such as the reduction and reuse of resources | |
| Transport | Realization of the “15-min City” (#953); Prohibit advertising aircrafts (#541) | Avoid | PaMs aims at lowering overall transport demand by fostering compact cities designs or prohibiting the advertisement of an emission-intensive mode of travel |
| Promote modal shift to the waterway (and rail) network (#147); National bicycle sharing scheme (#1056) | Shift | PaMs aim at shifting from road to waterway or active transport, thus supporting low-emission modes of service provision | |
| Accelerated deployment of charging infrastructure for electric and hybrid vehicles (#114); Making an additional domestic ferry climate neutral (#326) | Improve | PaM aims at incentivising market penetration of BEVs thus lowering the emission intensity of car-based transport without changing travel behaviour and/or demand, or electrifying an additional ferry without improving user experience | |
| Climate change communication (#1512); Financial incentives for Comprehensive Transport Strategies by local communities to promote planning of sustainable transport (#1350) | General | PaMs aim at changing broader framework conditions, lack specificity and could incentivise the application of avoid, shift and/or improve strategies | |
| Spatial policy aimed at modal shift and fewer trips (#23) | General (A/S) | PaMs represent a strategy mix that contains both avoid and shift aspects by aiming at shifting modal split and avoiding overall transport demand |
2.3. Data source and decomposition
Under Article 18 (1)(b) of the Governance of the Energy Union and Climate Action Regulation (European Parliament and European Council, 2018), EU member states report the GHG projections of their national modelling exercises on a biennial basis. Based on the national data received, the European Environmental Agency (EEA) compiles two European emission scenarios: First, the With-Existing-Measures (WEM) scenario reflects existing policies and measures; Second, the With-Additional-Measures (WAM) scenario incorporates not only already adopted and implemented policies, but member states’ proposed measures that are not yet implemented. The reported raw data covers the most recent projections from March 2023 and is thus suited for delivering a comprehensive overview of contemporary mitigation efforts across the EU. A total of 3342 PaMs are reported by 30 European countries, namely the EU27 and additionally Iceland, Norway and Switzerland.
For analysing the cross-sector distribution and instrument types, we rely on data collected as part of mandatory EU reporting requirements. Member states are required to select among the sectors of (a) energy supply, (b) energy consumption,6 (c) transport, (d) industrial processes, (e) agriculture, (f) land use, land-use change and forestry (LULUCF), (g) waste management, and (h) other sectors.7 In addition to sector specifications, the EEA mandates member states to specify the policy instruments through which PaMs are put into practice. In line with EU reporting standards, instruments are categorised into the following types:
(1) economic (i.e. measures that provide an economic incentive, such as subsidies, investment programmes, emission trading schemes, etc.)
(2) fiscal (i.e. measures that provide a financial incentive via taxes)
(3) voluntary/negotiated agreements (i.e. binding or voluntary standards/regulations agreed between regulators and target group)
(4) regulatory (i.e. measures that set binding standards and regulations or permitting systems, such as building regulation, etc.)
(5) information (i.e. measures such as labelling, awareness rising, voluntary standards),
(6) education (i.e. measures such as training programmes, workshops, seminars at all levels)
(7) research (i.e. measures providing of funds to allow for research programmes)
(8) planning (i.e. measures such as waste management plan, transport plan, urban planning, land use plan, etc.)
(9) other (i.e. measures that do not fit in any of the above)
Note that member states can assign one or multiple instrument types to individual PaMs, leading to a discrepancy of 563 between the total number of analysed PaMs and the reported instrument types. Since sector and instrument type reporting is a member state responsibility, interpretation bias may arise. Despite the availability of detailed reporting guidelines (European Commission and EEA, 2023), we find minor inconsistencies in reporting across member states.8
Our central concern to analyse PaMs incorporated into the European WEM and WAM scenarios necessitated further raw data decomposition. First, 1182 PaMs not included in any projection scenario were excluded from the raw data, leaving a total of 2159 PaMs. Second, due to our primary focus on end-use sectors, we excluded PaMs affecting the energy supply, LULUCF and waste sector. As a result, the analysis is limited to the sectors of agriculture, energy consumption, industrial processes, transport and other sectors. Limiting the analysis to end-use sectors further reduced the number of PaMs to a total of 1,584, with descriptive statistics on country shares shown in SM B.Res_Country. These refinements are justified for two reasons: Firstly, supply-side decarbonisation strategies tend to be relatively straightforward and accepted,9 whereas mitigation in end-use sectors, which directly affects end-users, is highly contested (Creutzig et al., 2018; Mundaca et al., 2019; Freeman et al., 2024). Secondly, end-use sectors are pivotal to achieve European climate targets by collectively accounting for approximately 68 % of the EU’s emissions in 2022, excluding emissions generated by the energy supplied to these sectors (EEA, 2023b).
Except for the case of France (FR), Luxembourg (LU), Italy (IT) and Spain (ES), PaMs are reported in English. Wherever possible (FR, LU), PaMs were analysed in the language of their reporting. In other cases (IT, ES), the respective policies – a total of 261 PaMs – were translated into English using the AI-powered translation and language tool DeepL10. We estimate inaccuracies in the analysis due to linguistic bias to be minimal due to the cautious coding approach applied necessitating all PaMs involving categorisation uncertainties to be reviewed by two peer coders, some of whom examined the material in both the original and translated language.
2.4. Process of categorising PaMs
After decomposing the raw data, individual PaMs were analysed and classified applying qualitative content analysis (Kuckartz, 2012, 2019). The coding procedure can be divided into three steps, with an overview of the process and the measures taken to prevent coding bias presented in Fig. 1. In the initial phase, the corresponding author conducted a pre-screening of the data, involving a first coding round. PaMs matching our predefined strategy definitions were coded accordingly, while those that did not match these definitions were assigned to a separate TBC (i.e. to be clarified; coded as 6) category for further clarification in the larger coder group. To ensure accuracy and prevent coder bias, a cautious approach was adopted, where any uncertainties regarding the classification of individual PaMs qualified the measure to be classified as TBC. This process qualified 665 PaMs (42 %) for the peer-reviewed coding procedure.
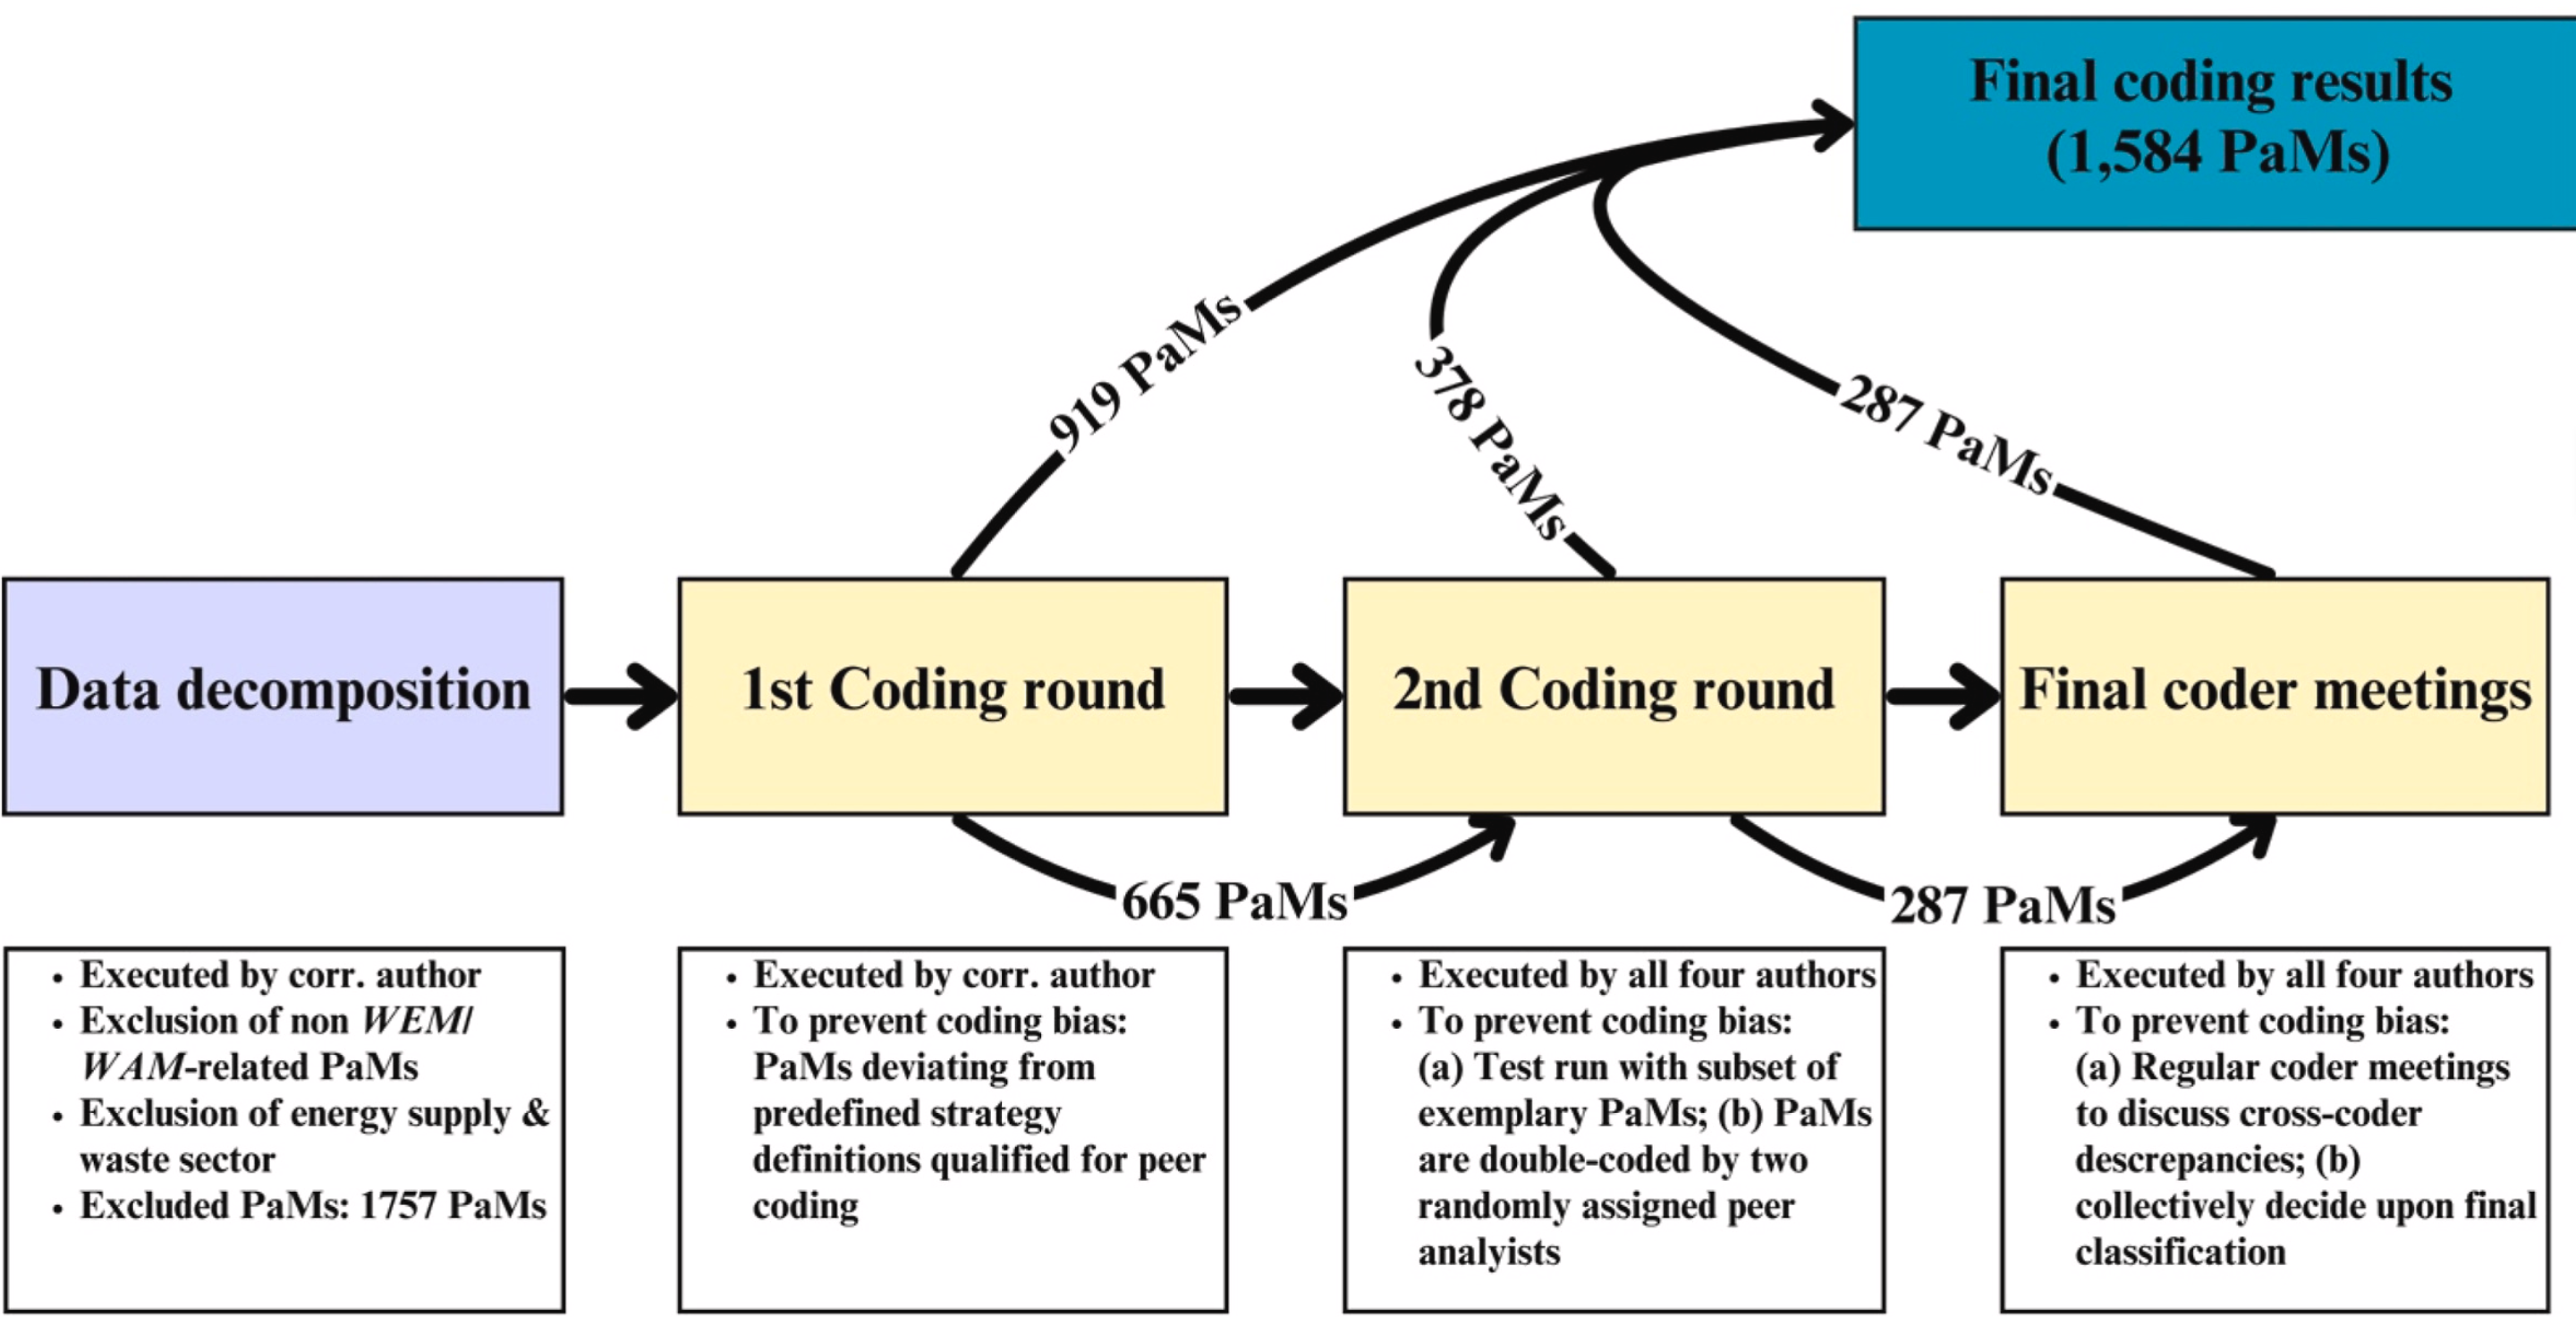
Fig. 1. Flow chart demonstrating the coding procedure.
In the second step, the team of four authors carried out the analysis and classification of PaMs requiring further scrutiny. This process involved randomly assigning individual authors to analyse a specific subset of countries and their respective PaMs. We follow the proceedings of Zell-Ziegler et al. (2021) and Lage et al. (2023) by pairing each author with a peer analyst for a predefined set of countries. To test our approach, we performed a preliminary coding run for a subset of 29 PaMs to foster a coherent understanding of the framework applied among all coders and facilitate discussions around strategy ambiguities. Subsequently, all authors coded a set of 325–340 PaMs of randomly assigned countries individually, with each PaM being independently reviewed by an author and a blind-peer analyst. Again, the category TBC (coded as 6) enabled coders to highlight PaMs that required clarification in the larger group of authors. Coders were furthermore required to outline their reason for coding choice in an additional column in the coding sheet.
Finally, coding results were compared between coders, with cross-coder discrepancies being observable in the case of 287 PaMs (43 % of the 665 peer-coded PaMs). This reflects the peer-reviewed coding procedure's focus on PaMs that were not clearly attributable during the initial coding round, highlighting the complexity of strategy identification. To resolve this, non-consistently coded PaMs were individually discussed and final classifications agreed upon during regular coder meetings.
Click to read more