Summary:
The current Social Security program faces a significant shortfall, equal to 4.2 percent of all future covered payroll over the next 75 years. This shortfall persists under alternative and favorable projections of fertility, interest rates, immigration and the projected impact of AI on future wages.
Key Points:
Modeling: PWBM uses a detailed microsimulation model to project Social Security’s future revenue and spending. The model incorporates individual-level data on earnings histories and family structures, along with rich demographics at the household level, including differences in fertility and mortality by marriage, income, race, education and many other factors. This approach provides a rich picture of how Social Security evolves under different assumptions relative to top-down models.
Baseline (current law and assumptions): PWBM projects that the Trust Fund depletes in 2034. At depletion, 83% of scheduled benefits would be payable, falling to 69% by 2099. PWBM projects a 75-year actuarial balance of –4.2% (a deficit) of taxable payroll. This means that Social Security could be made sustainable over the next 75 years if the current employer-employee combined Social Security payroll tax rate were raised from 12.4% to 16.6%, or an equivalent amount of spending cuts were made, or some combination of both.
Alternative Assumptions: More favorable forecast assumptions—higher fertility, increased immigration, faster real wage growth (e.g., due to even larger AI gains relative to our previous estimate), or higher interest rates—only modestly narrow Social Security’s financing shortfall. Combining all the favorable assumptions into one “combined scenario” reduces the 75-year imbalance balance from –4.2% to –3.6%, with just 75% of benefits payable in 2099.
The Long-Term Outlook for Social Security: Baseline and Alternative Assumptions
Introduction
PWBM uses a detailed microsimulation model to project Social Security finances over a 75-year horizon. The model incorporates individual-level data on earnings histories, family structures, and demographics, enabling detailed estimates of taxes and benefits. This approach provides a richer picture of how the system evolves under different assumptions.
Baseline Projection
We project that, under present law (“baseline”), the combined Trust Fund (OASI + DI) is projected to be depleted in 2034, after which only 83% of scheduled benefits can be paid. By the end of the projection horizon in 2099, the program would cover just 69% of promised benefits.
Under the baseline scenario, PWBM projects a 75-year actuarial balance of –4.20% of taxable payroll (a deficit). To restore solvency over 75 years on a conventional basis (not including macroeconomic effects), several options are possible:
1. More revenue: Raise payroll tax rates on taxable income immediately by an equivalent amount. This means increasing the employer-employee combined Social Security payroll tax rate on covered payroll from 12.4% to 16.6%. Other tax increases could include changes to the covered payroll tax base itself, such as increasing the taxable maximum.
2. Less spending: Cutting spending by an equivalent amount, either through a modification of benefits, slowing their growth rate over time, or changes to the normal retirement age.
3. Some combination of each.
In the past, we have estimated the impact of a range of policy reform options, including individual options and various policymaker proposals as well as a range of options for comprehensive reform plans. We will soon release updated reform options estimates.
This brief considers the sensitivity of Social Security’s baseline financial outlook, without any policy changes, to changes in key underlying demographic and economic projection assumptions that are central in modeling Social Security’s financial shortfall under current policy. We consider only favorable alternative projection demographic and economic assumptions that would help improve Social Security’s finances. To be clear, PWBM is not taking the position that these more favorable assumptions are more likely to occur than alternative assumptions that are less favorable than our baseline projections. Rather, this brief emphasizes that shortfalls exist even with more favorable assumptions.
Projections under Alternative, Favorable Assumptions
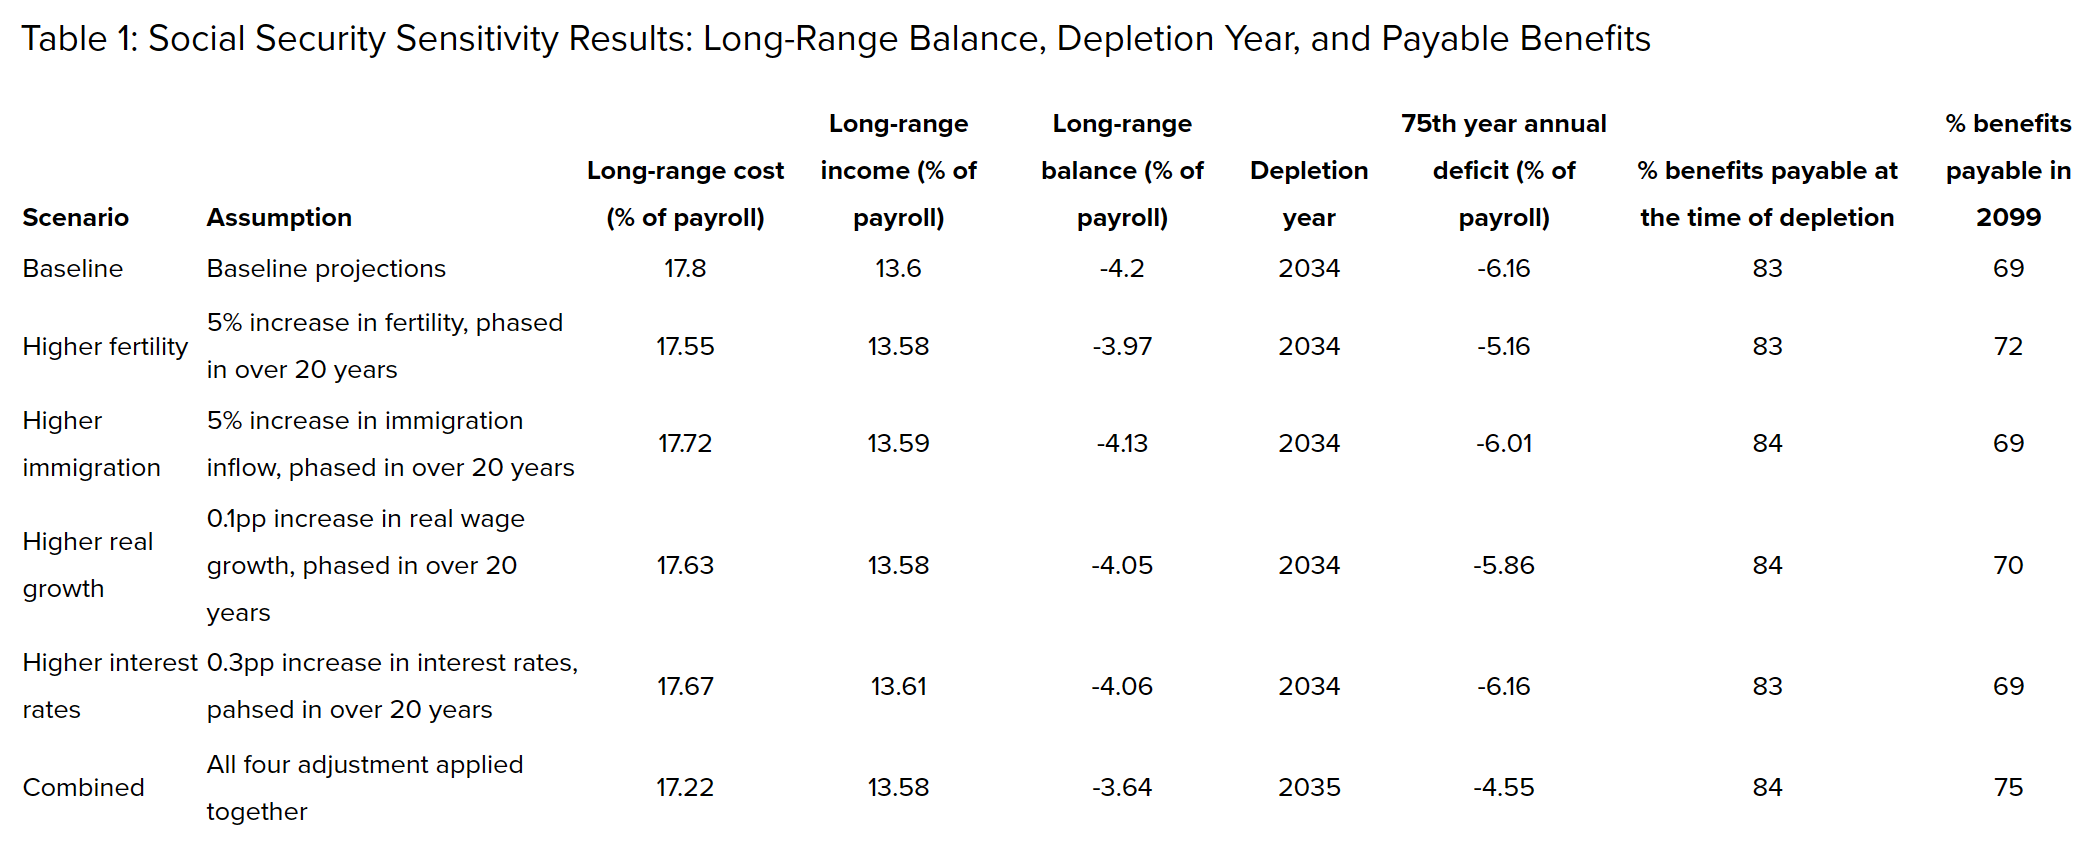
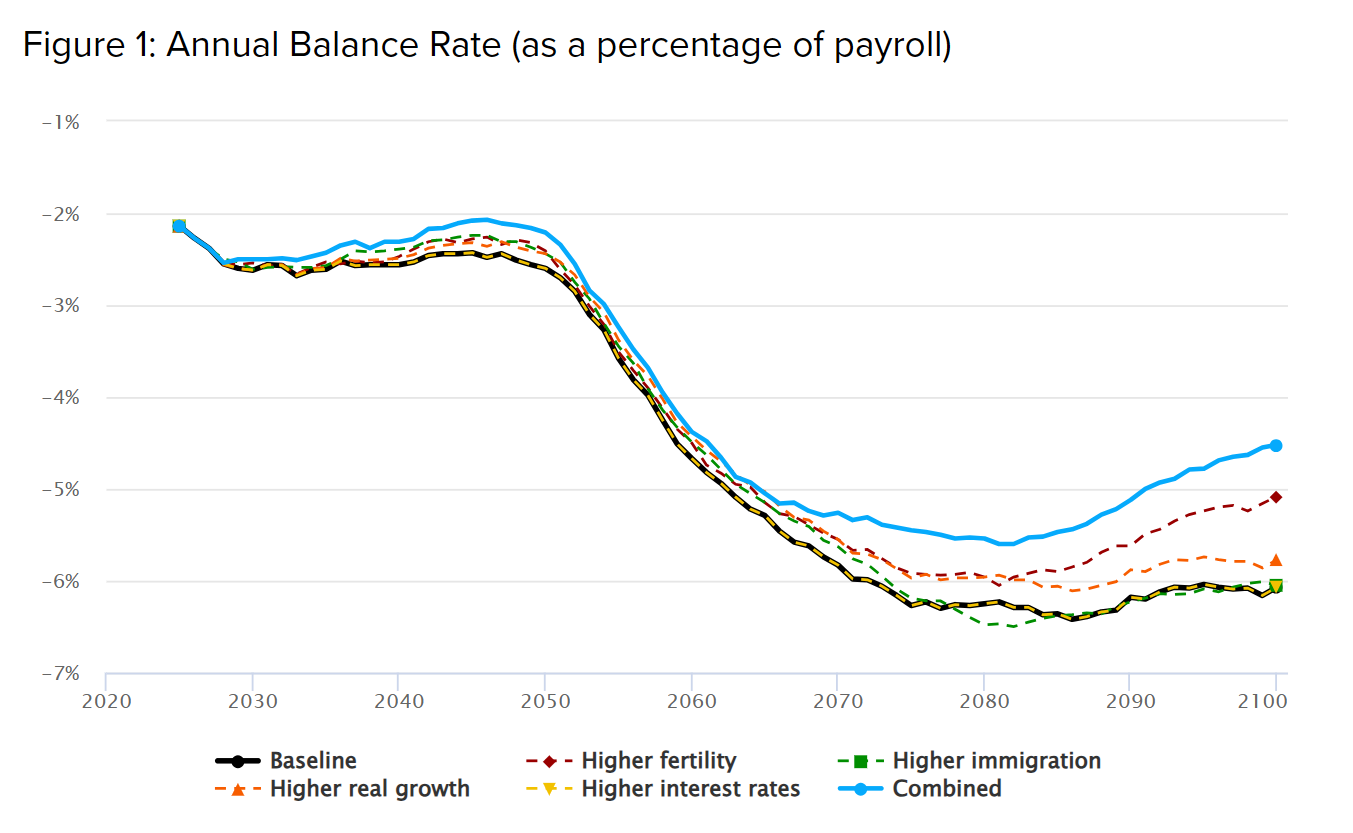
We start by changing each key demographic and economic assumption individually, one assumption at a time, with no changes in the other assumptions relative to baseline. We then present a combined case that changes all assumptions at the same time. The results are summarized in Table 1, while Figure 1 shows the annual balance rate (revenue less spending, expressed as a percentage of taxable payroll) under each scenario over time.
1. Higher Fertility Rate
In this scenario, the projected fertility rate (number of births per female) is assumed to rise by 5 percent gradually over 20 years beginning in 2026. Under the baseline, the total fertility rate increases from about 1.66 in 2024 to 1.87 in 2100. In the higher fertility scenario, the rate reaches 1.96 by 2100. This change lowers the old-age dependency ratio (the population aged 65 and over relative to those ages 20 to 64) from 0.46 to 0.44 by 2100.
Because the change takes time for newborns to grow into the workforce, the Trust Fund depletion year is unchanged by this alternative assumption, remaining at the year 2034, with 83% of scheduled benefits still payable at that time. By 2099, the payable share rises to 72%, and the 75th-year annual balance improves to –5.16%. Over the full projection horizon, the 75-year actuarial balance improves to –3.97% of taxable payroll, compared to –4.20% in the baseline. Overall, this scenario closes about 5% of the 75-year-range deficit and 16% of the 75th year annual deficit, making it one of the most impactful single demographic adjustments—though still insufficient to restore solvency.
2. Higher immigration
Next, we examine the effect of increased immigration. We raise long-run immigration (both authorized and unauthorized) inflows by 5 percent, phased in over 20 years. The total population size is larger under this experiment than under the baseline—by 0.4% in 2055, 0.7% in 2075, and 1.0% in 2100.
The Trust Fund depletion year remains unchanged, at the year 2034, with 84% of scheduled benefits still payable at that time. By 2099, the payable share is 69%, and the 75th-year annual balance improves slightly to –6.01%. Over the full projection horizon, the 75-year-range balance improves to –4.13% of taxable payroll, compared to –4.20% in the baseline.
3. Higher Real Growth
We now consider a faster real wage growth rate, modeled as an extra 0.1 percentage point annual increase phased in over 20 years. Relative to baseline, the economywide average wage increases by 2% by 2055, 4% by 2075 and by 7% by 2100. These gains are roughly in line---a bit smaller in the short run but larger in the long run---with the gains that we recently estimated for the impact of Generative AI on future productivity and wages. Since those AI-related gains are already in our baseline economy, the current experiment is akin to assuming that future gains from generative AI will be more than twice as large as our recent estimate already in our baseline.
The Trust Fund depletion year remains 2034, with 84% of scheduled benefits still payable at that time. By 2099, the payable share rises slightly to 70%, and the 75th-year annual balance improves to –5.86%. Over the full projection horizon, the 75-year-range balance improves to –4.05% of taxable payroll, compared to –4.20% in the baseline. Overall, this scenario closes about 4% of the 75-year-range deficit and 5% of the 75th-year annual deficit. Faster wage growth provides some relief, but not enough to resolve the shortfall.
The modest nature of the gains to Social Security reflects the fact that a newly eligible worker’s initial benefits are adjusted upward to reflect the general rise in wage levels over their working years, a calculation known as wage indexation. Subsequent benefits, received in future years, are then adjusted only for inflation. Because Social Security benefits mostly keep pace with wage growth, there is little gain from wage growth itself, apart from the fact that benefits received after eligibility are indexed only to inflation.
4. Higher interest rates
Next, we examine the effect of higher nominal interest rates on the Trust Fund, modeled as a long-run 0.3 percentage point increase phased in over 20 years, from 4.4 percent to 4.7 percent in the long run.
The Trust Fund depletion year remains 2034, with 83% of scheduled benefits still payable at that time. By 2099, the payable share is 69%, and the 75th-year annual balance remains -6.16%, unchanged from the baseline. With higher interest rates, there is no change in the annual income or cost rate, because annual income includes only payroll taxes and benefit taxation. The improvement instead comes through the long-range actuarial balance. Higher interest rates increase the discounting of future deficits, and because the largest deficits occur in the distant future, their present value is reduced. Over the full projection horizon, the 75-year-range balance improves slightly to –4.06% of taxable payroll, compared to –4.20% in the baseline. Overall, this scenario closes about 3% of the 75-year-range deficit but has no effect on the 75th-year annual deficit.
5. Combined Scenario (all alternative assumptions)
Finally, we consider the combination of all four favorable assumptions: higher fertility, higher immigration, faster real growth, and higher interest rates.
The Trust Fund is projected to be depleted in 2035, about one year later than in the baseline, with 84% of scheduled benefits still payable at that time. By 2099, the payable share rises to 75%, and the 75th-year annual balance improves to –4.55%. Over the full projection horizon, the 75-year-range balance improves to –3.64% of taxable payroll, compared to –4.20% in the baseline. Overall, this combined scenario closes about 13% of the 75-year-range deficit and more than 26% of the 75th-year annual deficit.
Sophie Shin produced this analysis under the direction of Kent Smetters. Mariko Paulson and Youran Wu contributed programming support to the analysis. Mariko Paulson prepared the brief for the website. We thank Heidi Williams for helpful comments on an earlier version.
Media (only): For the fastest response, email us at inquiries-pwbm@wharton.upenn.edu.
All other responses: Please use our Contact Us.
Sign up for PWBM Breaking News, Alerts and Newsletter. Unsubscribe anytime.
Click to read more