Abstract
The environmental Kuznets curve postulates an invert ed-U relationship between environmental degradation and economic growth. And economic growth has been synon ymous with structural transformation. How do patterns of growth and structural transformation relate to carbon emis sions? Based on data across almost 100 countries between 1960 and 2017, we find that the movement of workers into the manufacturing and services sectors is associated with a higher carbon emissions intensity of GDP. How ever, this positive association diminishes at higher shares of employment in both the manufacturing sector and modern, knowledge-intensive services. The diminishing positive association between emissions intensity and structural transformation towards these sectors is more discernible for developing economies compared with advanced econ omies. Further, based on sector-specific carbon emissions across 66 countries between 1995 and 2018, we find evi dence of convergence in the carbon emissions intensity of production across countries in all sectors, with the potential for further reductions in developing economies, especially given relatively high indirect carbon emissions through inter-sectoral linkages.
1. Introduction
Economic growth has been historically associated with structural changes in national economies. The pioneering work of Fisher (1935), Clark (1940), Chenery (1960), and Kuznets (1971) postulated a set of stylized facts from empirical evidence relating to the now-industrialized countries. They found that in the early stages of economic development, the agriculture sector’s share in both output and employment is overwhelmingly large. Subsequently, as industrialization proceeds, the agriculture sector’s share falls, and the manufacturing sector’s share rises. Once countries have industrialized and reached an advanced stage of economic development, the manufacturing sector’s share declines, and the service sector’s share increases. This process of industrialization has been synonymous with economic growth owing to the movement of surplus labor from (subsistence) agriculture to (capitalist) manufacturing and capital accumulation in the latter (Lewis 1954). This is reflected in large and systematic differences in labor productivity between the agriculture and manufacturing sectors across countries (Caselli 2005; Herrendorf, Rogerson, and Valentinyi 2014; Restuccia, Yang, and Zhu 2008).
This process of structural transformation has also been associated with the environmental Kuznets curve that depicts an inverted-U relationship between environmental degradation (i.e., pollution) and economic development (i.e., per capita income). In other words, per capita income and pollution intensity go hand in hand at lower levels of per capita income while pollution intensity begins to decline beyond a threshold level of per capita income. The structural change hypothesis conjectures that economies shift from low polluting agriculture to high polluting industry and eventually shift again to low polluting services (Panayotou 1993). Panayotou et al. (2000) summarize: “At low levels of development, both the quantity and the intensity of environmental degradation are limited to the impacts of subsistence economic activity on the resource base and limited quantities of biodegradable wastes. As agriculture and resource extraction intensity increase and industrialization takes off, [...] structural change towards information-based industries and services can result in a decline in environmental degradation”.
Empirical analyses of how structural transformation interacts with the carbon intensity of production are few and far between. Some empirical studies on advanced economies find that a higher share of industry in total GDP is associated with higher environmental pressure or energy intensity (Suri and Chapman 1998, Hettige et al. 2000). Other studies find that shifts toward the services sector have contributed to reducing the energy intensity of economic activity (Duro et al. 2010, Mulder et al. 2014). A further set of studies use decomposition analyses to compare the contributions of structural change and technological change in reducing the pollution intensity of economic activity. On one hand, De Bruyn (1997) finds that structural change is much less important than technological change in explaining the reduction of pollution in the Netherlands and West Germany during the 1980s. On the other hand, Weber (2009) finds that the contribution of structural change in explaining the decline in total energy intensity in the United States between 1997 and 2002 exceeded that of increased energy efficiency. Using data between 1995 and 2009, Marsiglio, Ansuategi and Gallastegui (2015) find that structural change was responsible for more than 50 percent of the change in carbon intensity in many European countries.
The literature cited above is limited to advanced economies. Moreover, several developing countries have been characterized by unconventional patterns of structural transformation over the past three to four decades. The shares of manufacturing in employment and value added have peaked at lower levels of per capita income than what occurred in the past in the now industrialized countries (Rodrik 2016). Synonymously, much of the declining share of agriculture in employment and value added has been offset by the services sector. The pattern of growth within the services sector itself has also been changing. Eichengreen and Gupta (2013) identify two waves of services sector growth, with the first wave consisting primarily of traditional services as countries move from “low” toward “middle” income status and the second wave comprising modern, knowledge intensive services (in finance, communication, and business) as countries move from “middle” toward “high” income status. The authors find that the second wave started at lower levels of per capita income after 1990 than in the preceding four decades. This matters for the interaction between structural change and carbon emissions as knowledge-intensive services are perceived to be less polluting.
How do these patterns of growth and structural transformation relate to the carbon intensity of production? We aim to fill this gap in the literature by analyzing patterns of growth, structural transformation, and carbon emissions intensity across more than 100 countries between 1960 and 2017, as well as detailed data on emissions intensities for 45 sectors across 66 countries between 1995 and 2018.
Overall, we find that the movement of workers from agriculture into manufacturing or services is positively associated with the carbon emissions intensity of GDP, irrespective of the stage of structural transformation that a particular country is in. This result holds even after controlling for GDP per capita and energy consumption. The effect of an increase in the share of manufacturing employment on a country’s overall carbon emissions intensity is higher than that of an increase in the share of services employment across the distribution of employment shares of both sectors.
At the same time, for manufacturing-driven structural transformation, the positive association between the manufacturing employment share and carbon emissions intensity diminishes as the manufacturing employment share increases. There is a more constant relationship between services-driven structural transformation and carbon emissions intensity of GDP. The results for services reflect, at least in part, the heterogeneity of activities within the services sector. Much like the manufacturing sector, the positive association between the employment share in modern, knowledge-intensive services and carbon emissions intensity diminishes as the employment share of these services increases. The more muted relationship between structural transformation and emissions intensity for the services sector is driven by traditional services.
We also find heterogeneous effects across countries at different levels of per capita income. The decline in the carbon emissions intensity of production associated with an increase in the employment share of manufacturing and modern knowledge-intensive services is more pronounced for low- and middle-income countries than for high-income countries. This is consistent with evidence on the diffusion of less-carbon intensive production technologies from high-income countries to low- and middle-income countries among tradable sectors.
Further, we find important links between growth and the carbon emission intensity of production that go beyond structural transformation. First, there is evidence of convergence between developing economies and advanced economies in the carbon emissions intensity of production across the agriculture, manufacturing, and services sectors. Second, there is still further room for developing economies to reduce their levels of carbon emissions intensity across sectors even relative to countries in the same income group. Third, much of these gains from further reducing carbon emissions in developing countries is likely to come from reducing indirect emissions associated with inputs from other sectors.
Our paper contributes, first and foremost, to the literature on structural transformation and growth. Rodrik (2012) shows that labor productivity in (formal) manufacturing exhibits “unconditional convergence” across countries. Therefore, labor productivity in lagging manufacturing sectors, such as those in low- and middle-income economies, tends to rise and eventually converge with the global technological frontier regardless of policy and institutional determinants. Similarly, Duarte and Restuccia (2010) find that high productivity growth in the manufacturing sector explains about 50 percent of the catch-up in relative aggregate productivity across countries. More recent evidence finds that services growth can contribute to lower-income countries’ ability to catch up as well (Herrendorf, Rogerson, and Valentinyi 2022; Kinfemichael and Morshed 2019). Baymol and Sen (2020) validate the positive development effects of structural transformation into manufacturing that also reduces income inequality but find that income inequality increases with the movement of workers from agriculture to services.
Our paper also contributes to the literature on structural transformation and climate change. Several studies document how climate change-related extreme weather events are moving workers out of the agriculture sector. In India, a 1-degree Celsius increase in the daily average temperature corresponded to a decrease of 7.1 percentage point decline in agricultural employment, and an increase of 2.0 and 3.4 percentage points, respectively, in manufacturing and services employment, respectively between 2001 and 2007 (Colmer 2021). In Brazil, employment in localities with higher incidence of droughts during 2000-2010 shifted more rapidly from agriculture toward manufacturing (Albert et al. 2021). Using a dataset of 700 million scraped online job adverts from 35 high- and middle-income countries, Bastos et al. (2024) find that low-carbon technology jobs are most likely to be in the manufacturing, construction, sales, and high-skilled white-collar services. Evidence from the United States shows that green activities are biased toward cognitive, ICT, management, technical and engineering tasks (Curtis et al. 2023, Vona et al. 2018), which have reallocated economic activity toward college-educated workers (Sato et al. 2023).
Last, but not least, our paper contributes to the broader literature on the environmental Kuznets curve. The inverted U-shaped relationship between pollution or emissions and per capita income may be attributable not only to the structural transformation that accompanies economic growth but also to the impact of regulation on pollution abatement and changes in technology (Grossman and Krueger, 1995). The role of regulations in explaining the decline in pollution as countries grow beyond middle-income status is well documented in the literature (Dasgupta et al. 2002). The role of technological change has also been the subject of much analysis. Cohen et al. (2017) find that the environmental Kuznets elasticity, i.e., the relationship between GDP growth and emissions growth, declined from 1.1 in the post-World War II period from 1946-1982 to 0.66 between 1983 and 2007. This is indicative of an improved technical frontier for energy efficiency and the availability of lower-carbon energy sources. Like other technologies, the development of several key low-carbon technologies has occurred in advanced economies. And costs of many such technologies ─ including solar panels, wind turbines, lithium-ion batteries and electrolyzers used for green hydrogen ─ has fallen rapidly and exponentially over the past four decades (Way et al. 2022, Arkolakis and Walsh 2023). Bastos et al. (2024) find that the share of jobs related to low carbon technologies doubled in 2022 relative to 2021 and around 70 percent of these new job openings were in advanced economies with the highest numbers in the United States.
The remainder of the paper is structured as follows. Section 2 presents a conceptual framework to assess the Kuznets process of carbon emissions intensity changing with structural transformation. Section 3 describes the data and provides descriptive statistics around patterns of structural transformation and carbon emissions intensity. Section 4 presents the empirical strategy. Section 5 discusses results. Section 6 comprises extensions to the preceding analysis that assesses the relationship between growth and emissions beyond structural transformation. In doing so, it analyzes the carbon intensity of growth acceleration episodes over time; documents patterns of convergence in the emissions intensity of production across countries in all sectors; estimates potential reductions in emissions intensity with access to better technologies; and distinguishes between the importance of direct and indirect emission intensities across sectors. Section 7 concludes.
2. Conceptual Framework: The Kuznets Environment Curve and Structural
Transformation
The structural change hypothesis proposes that the process of economic growth is associated with a shift in production from low- to high-polluting economic activities. The Kuznets process of emissions intensity changing with structural transformation can be described as the sum of two processes: (a) the between-sector effect that comprises the movement of workers from less to more emissions-intensive sectors or vice-versa, and (b) the within-sector effect which consists of the changes in emissions intensity within sectors. If both processes reinforce each other, i.e., if the movement of workers is from a sector with lower emissions intensity to a sector with higher emissions intensity and if the decline in emissions intensity of the latter is slower than of the former, then structural transformation will unambiguously increase emissions intensity. However, if the movement of workers is to a sector with higher emissions intensity but also a larger decline in the emissions intensity over time, then overall emissions intensity will not necessarily increase.
We provide suggestive evidence on these “between-sector” and “within-sector” effects by distinguishing between the movement of workers from agriculture into either the manufacturing sector or the services sector. This is based on detailed data from the International Monetary Fund on carbon emissions intensities for 45 sectors across 66 countries between 1995 and 2018. Are the effects of manufacturing-driven structural transformation on a country’s overall intensity of carbon emissions likely to be different than that for services-driven structural transformation?
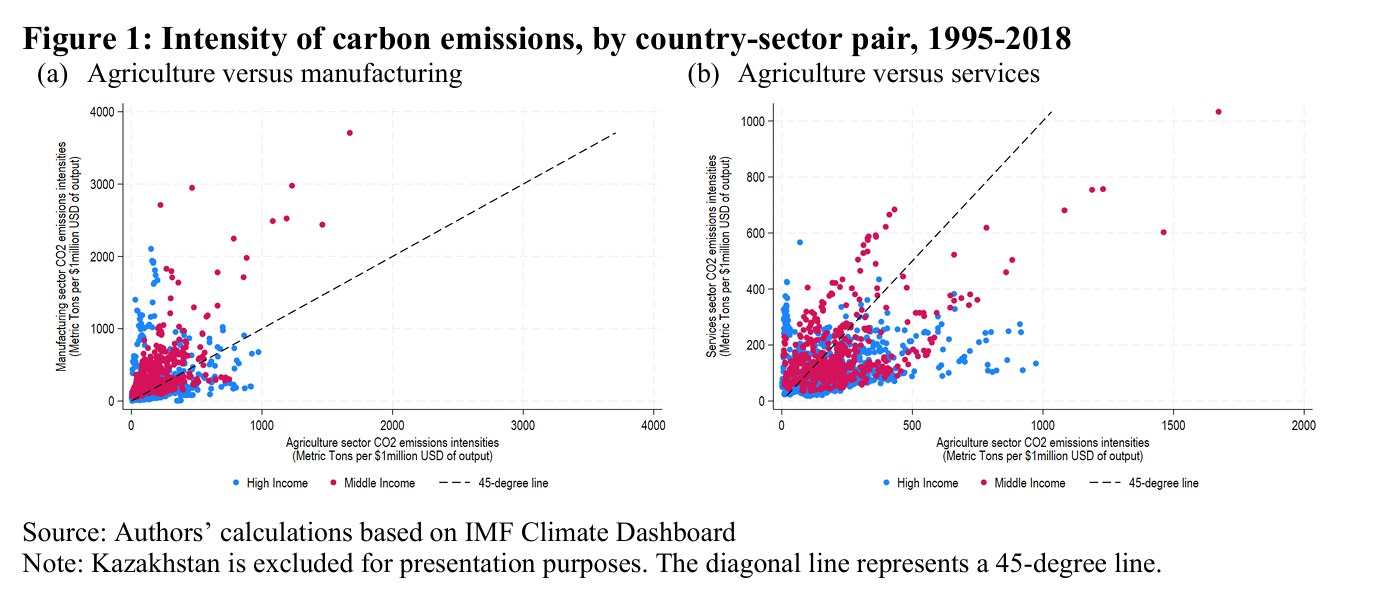
We first consider between-sector differences in carbon emissions intensity. For this component to increase with structural transformation, emissions intensity in the sector absorbing labor from agriculture must be higher than the emissions intensity prevailing in agriculture. Pooling observations across countries and over time, it is not always the case that the carbon emissions intensity in the manufacturing sector exceeds that in the agriculture sector for country-year pairs (Figure 1a). Similarly, it is not always the case that carbon emissions intensity in the services sector exceeds that in the agriculture sector for country-year pairs (Figure 1b). However, among the middle-income countries in the sample, the carbon emissions intensity in the manufacturing sector typically exceeds that in agriculture. This implies that structural transformation out of agriculture toward manufacturing is likely to increase the overall carbon intensity of production.
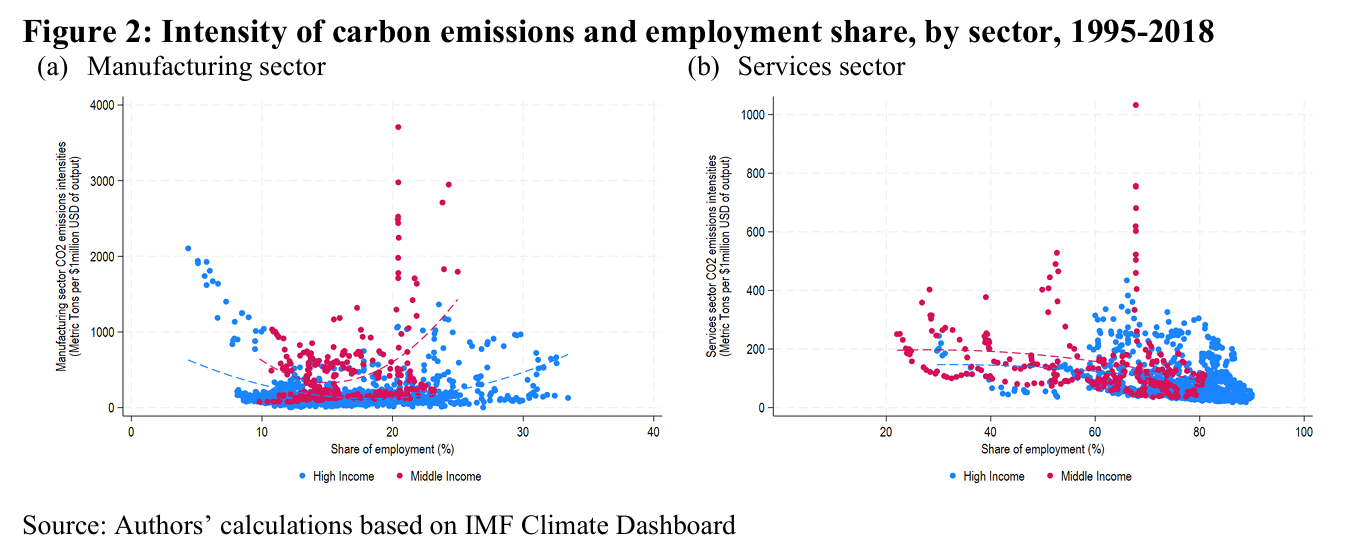
We next consider within-sector differences in carbon emissions intensity. This component of overall emission intensity may decline or increase with structural transformation owing to technological change or the changing composition of industries within broad sectors. There is no clear relationship between employment shares and carbon emissions intensity in the manufacturing sector across countries and over time (Figure 2a). If anything, there is a positive relationship between the two past a threshold share of the manufacturing sector in total employment both in high- and middle-income countries. In contrast, there is a weak negative relationship between employment shares and carbon emissions intensity in the services sector across both high- and middle-income countries (Figure 2b). This suggests that the Kuznets argument, which proposes that the movement of workers from agriculture to non-agriculture will be exacerbated by the within-sector component of emissions intensity, is likely to hold more for the manufacturing sector than the services sector.
3. Data and Descriptive Statistics: Patterns of Structural Transformation and Emissions Intensity
We assess the relationship between patterns of structural transformation and the carbon emissions intensity of GDP using a database that covers almost 100 countries between 1961 and 2017. Data on employment by sector is drawn from the World Bank Productivity Database and Groningen Growth and Development Center Database. The corresponding data on carbon emissions intensity of GDP is based on the Our World in Data database. Data on the carbon emissions of GDP is more limited in its country coverage for the earlier decades in the database. This ranges from around 10 countries in the 1960s and 40 countries in the 1970s to 50 countries in the 1980s. Most countries have data on the carbon emissions of GDP starting in 1995.
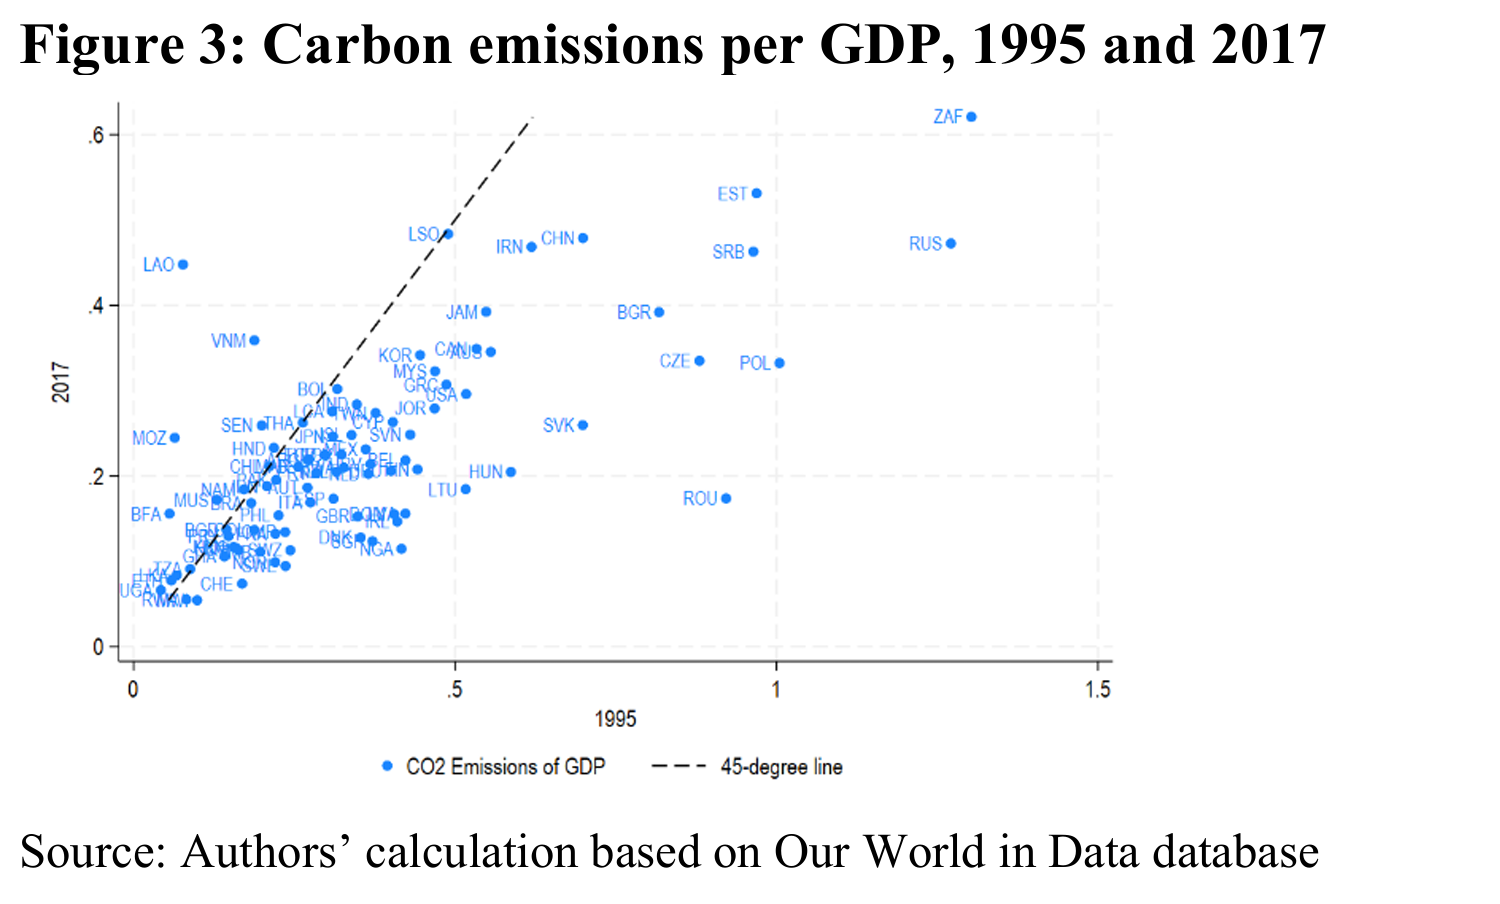
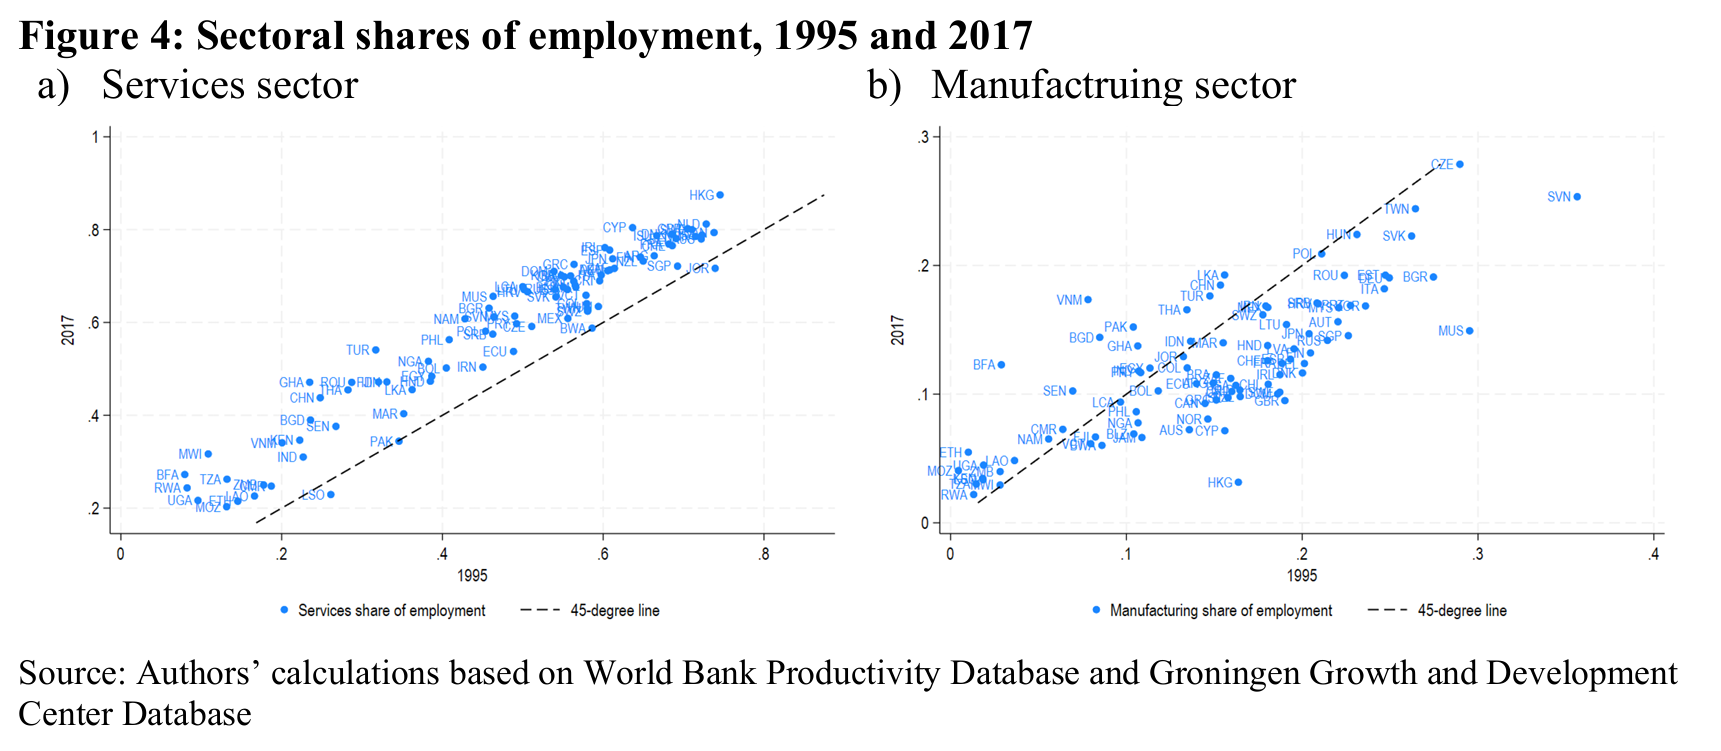
There is variation both across countries and over time. The carbon emissions intensity of GDP declined in most countries between 1995 and 2017 (Figure 3). In terms of structural transformation, the share of employment in the services sector increased between 1995 and 2017 across almost all countries and accounts for as much as two-thirds and three-fourths of employment in high-income countries (Figure 4a). The share of employment in the manufacturing sector declined between 1995 and 2017 in several countries – reflecting conventional deindustrialization in today’s high-income countries as well as premature deindustrialization in developing countries. The share of employment in the manufacturing sector increased in a handful of developing countries during this period (Figure 4b).
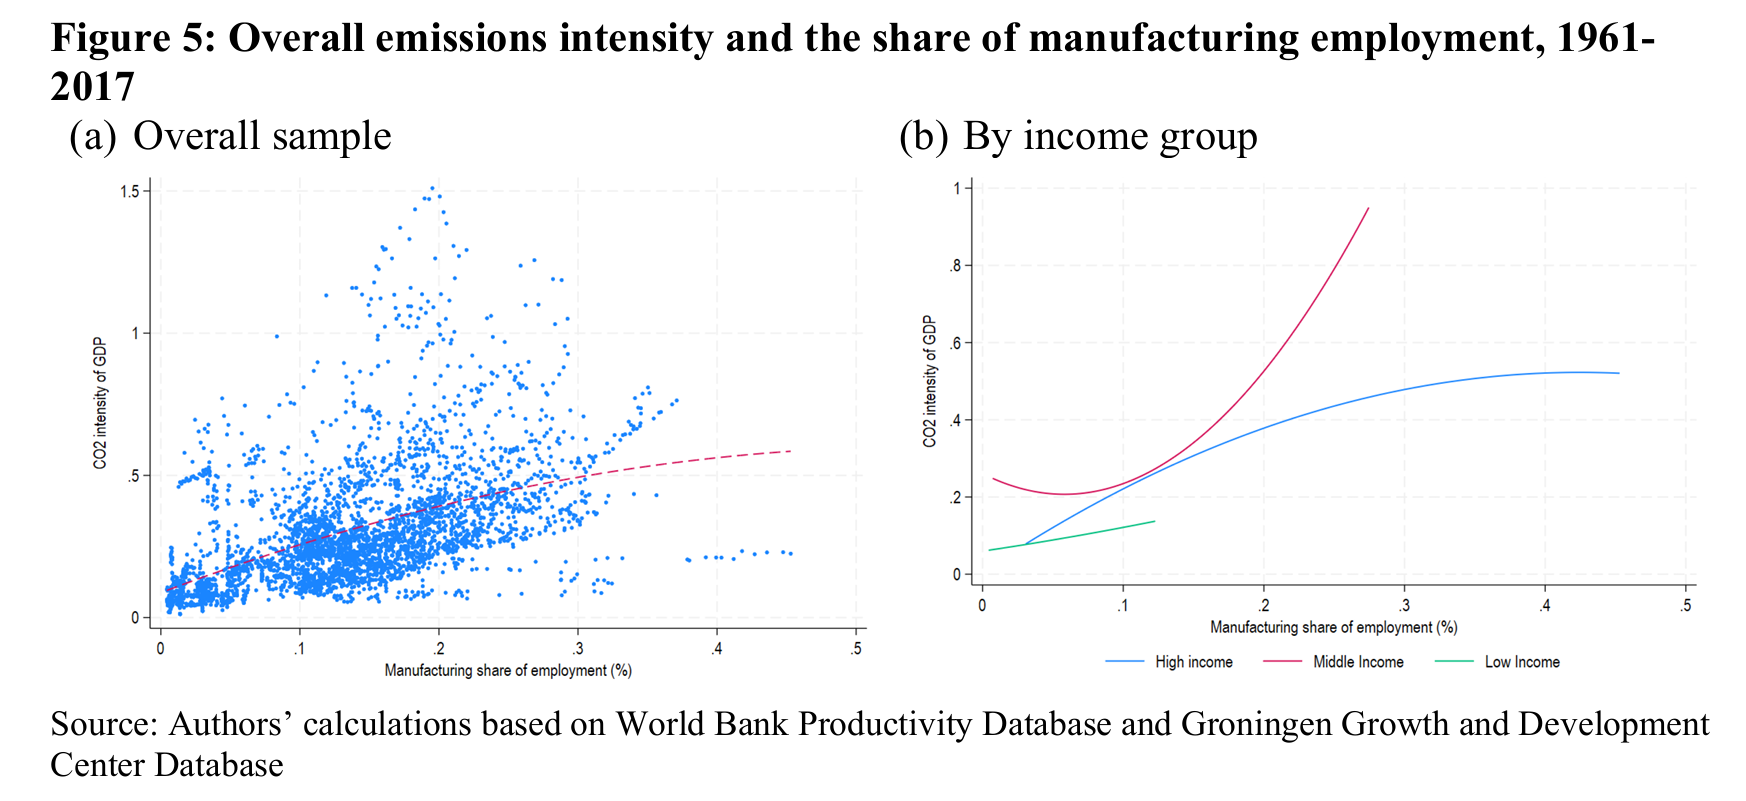
We first look at the overall relationship between manufacturing-driven structural transformation and emissions intensity across countries and over time, then by country group. In the overall sample, we see a positive relationship between the manufacturing employment share and carbon emissions intensity. Beyond a threshold level, there is a mild deceleration in the carbon emissions intensity as the employment share of the manufacturing sector increases (Figure 5a). By country group, we see this mild deceleration in the carbon emissions intensity as the manufacturing employment share increases for high-income countries. For low- and middle-income countries, there is a positive relationship between manufacturing-driven structural transformation and carbon emissions intensity (Figure 5b).
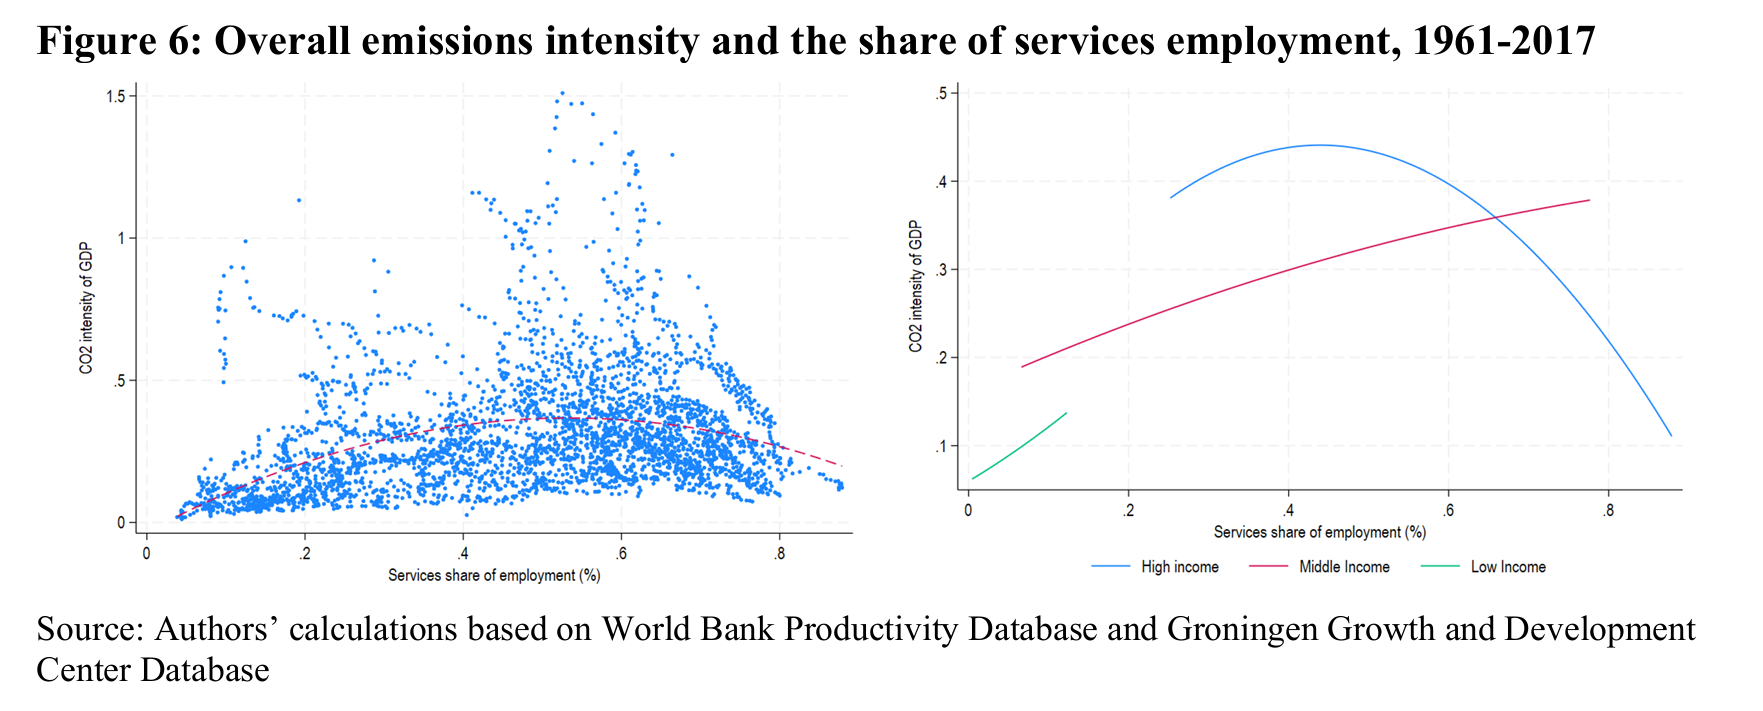
We next look at the relationship between services employment share and carbon emissions intensity for the overall sample and then by country group. In the overall sample, there is an inverted U-shaped relationship, i.e., beyond a threshold level, there is a decline in the carbon emissions intensity as the employment share of the services sector increases (Figure 6a). By country group, we see a U-shaped relationship for high-income countries, and a positive relationship for middle-income countries (Figure 6b).
Overall, the scatter plots suggest that there is a clear inverted U-shaped relationship between services-driven structural transformation and carbon emissions intensity, and a largely positive relationship between manufacturing-driven structural transformation and carbon emissions intensity. We now proceed to an econometric analysis of the relationship between structural transformation and carbon emissions intensity.
Click to read more