Abstract
This paper presents the first estimates of extreme child poverty and child poverty using the World Bank’s recently revised international poverty lines. Using the international poverty line of $3.00 per day and the higher $8.30 per day poverty line (both expressed in 2021 purchasing power parity), the paper provides new results of the global and regional trends over 2014–24. The estimates show that 19.2 percent of children, approximately 412 million children, were living on less than $3.00 (2021 PPP) per day as of 2024, a reduction from 507 million children in 2014. This long-term decrease was slower than that for the general population. At the higher line of $8.30, the child poverty rate in 2024 was 65.9 percent, representing around 1.4 billion children, a drop from the 73.1 percent registered in 2014. At the regional level, the East Asia and Pacific and South Asia regions witnessed significant reductions in child poverty and extreme child poverty between 2014 and 2024, and the Europe and Central Asia and Latin America and the Caribbean regions showed reductions mostly in child poverty. In the same period, there was an increase in extreme child poverty in the Middle East and North Africa region. Sub-Saharan Africa experienced a “lost decade” of child poverty reduction between 2014 and 2024, increasing its concentration of global poverty. In 2024, Sub-Saharan Africa hosted more than three-quarters of children in extreme poor households (more than 311 million children), although its share of the global child population was around 23 percent. Country-level results show evidence of regional heterogeneity in progress against extreme child poverty.
Introduction
With just five years remaining until 2030, there is mounting evidence that the world is not on track to meet all the Sustainable Development Goal targets (World Bank 2024a) (United Nations 2024), including SDG1 on “Ending poverty in all its forms everywhere”. Global commitments and efforts have been hampered by the COVID-19 pandemic, armed conflicts, economic instability, and climate-related disasters limiting peoples’ economic opportunities and putting families in hardship. As the window for action narrows, addressing poverty among the most vulnerable population groups with renewed urgency is essential. Recent and accurate evidence to inform policies is a key ingredient to achieve this. This note aims to contribute to this dialogue by presenting the most comprehensive and recent global estimates of monetary poverty among children.
This note is the fourth edition of a World Bank and UNICEF series of studies looking at global and regional estimates of child poverty using World Bank established international poverty lines.1 Children are individuals below the age of 18 (per the UN’s Convention on the Rights of the Child). Their poverty status is defined by whether they reside in households with per capita income or consumption per day below a given poverty line. The analysis focuses on the 2014-2024 period.
To provide a broad view of children’s welfare, this note relies on two definitions of poverty. Extreme poverty is based on the international poverty line (IPL) of US$3.00 per person per day in 2021 purchasing power parity (PPP). To better reflect the evolution of price levels across the world, the World Bank revised the IPL from $2.15 to $3.00 per day following the May 2024 release of the 2021 PPPs by the International Comparison Program. The revision of the IPL, along with other lines for lower- and upper-middle income economies, also incorporates recent improvements in measurement of well-being across countries and provides the most accurate estimate of global poverty. The revised poverty lines were published by the World Bank in June 2025 (Alfani et al. 2025).
Poverty status, in turn, is defined according to a different, higher threshold: $8.30 (2021 PPP) per person per day. There are several reasons for presenting results based on a higher threshold. This threshold is the median poverty line for upper-middle income countries and has been tracked by the World Bank since 2017.2 As Ferreira and Sanchez-Paramo (2017) noted, the higher line could be interpreted as a response to partly address the notion that achieving a set of capabilities (i.e. the ability to stay warm or effectively look for a job) requires different baskets of goods and services (that will have varying costs) in different countries. Thus, this line is a more relevant measure for assessing poverty in middle-income countries where extreme poverty under the international poverty line is no longer prevalent. The higher line is also a vision indicator in the World Bank Group Scorecard (World Bank 2025a).
As in previous studies, (extreme) child poverty in this note refers to children living in households who are considered (extreme) poor. This is an important distinction as the estimates are all based on using a per capita welfare measure that allows for comparability across a large set of countries. The welfare measure is based on a household’s total income or total expenditure that is then divided by the number of members in the household (i.e., by household size). A known limitation of this approach is that it does not account for any differences in resource allocation within the household.3 Throughout the paper the main indicator of interest is thus labeled as the child poverty rate but the reader should keep this caveat in mind.
This paper uses the most recent and comprehensive collection of survey microdata to analyze poverty at the global level. Using data for over 152 economies, including 85 surveys collected post-COVID-19, this study provides the first set of global and regional estimates for the period 2014-2024. Estimates show that 19.2 percent of children, or approximately 412 million, were residing in households living on less than $3.00 (2021 PPP) per person per day as of 2024, a reduction from 507 million children in 2014. This downward long-term trend is slower than for the general population. At the higher international poverty line of $8.30, the child poverty rate in 2024 was 65.9 percent, representing around 1.4 billion children. Using the groupings in UNICEF (2023), heterogeneous regional trends in child poverty become evident. Sub-Saharan Africa has experienced a “lost decade” of child poverty reduction between 2014 and 2024. Moreover, more than three-quarters of children in extreme poor households (over 311 million children) resided in the region in 2024, despite its share of the global child population standing at around 23 percent. The East Asia and Pacific (EAP) and South Asia (SA) regions witnessed significant reductions in child poverty during the same period, while there is evidence of an increase in child poverty in the Middle East and North Africa (MENA) region. At the higher benchmark of $8.30, which is considered of more relevance to middle-income contexts, both the Europe and Central Asia (ECA) and Latin America and Caribbean (LAC) regions showed reductions in child poverty. The general positive story around child poverty reduction found in global and regional trends builds from the projected gains countries have made. However, data also suggests heterogeneity across the world, with some countries showing significant progress in reducing child poverty, while others have witnessed stagnated progress or even an increase in extreme child poverty, especially those facing conflict, fragility, and climate shocks.
The note is structured as follows. The next section provides a short overview of related literature, followed by a section describing the methodology and data underlying the poverty rate estimations. Next, the results are presented at the global, regional and national levels in that order. A final section concludes.
Earlier results on child poverty
Literature on global poverty measurement has documented the disproportionate burden borne by children. Newhouse et al. (2016)4 conducted one of the first attempts at measuring child poverty globally after the adoption of the Sustainable Development Goals and the SDG’s particular emphasis on disaggregating poverty and other measures of welfare by age. Looking at data for 89 countries, the authors produced estimates of global poverty for 2013 and found that 19.5 percent of children were estimated to live on less than $1.90 per day (2011 PPP), as opposed to 9.2 percent of adults ages 18 and above. Silwal et al. (2020) continue this line of research. Using a more recent vintage of the Global Monitoring Database, the authors produce a global estimate for 2017 and find there had been progress from 2013: 17.5 percent of children were living under the $1.90 per day (2011 PPP) poverty line.
Salmeron Gomez et al. (2023) expand substantially the understanding around child poverty by providing estimates for the trajectory of extreme child poverty (children living in extremely poor households earning less than $2.15 in 2017 PPP) from 2013 to 2019 and complementing them by a nowcasting exercise for 2020 to 2022. The authors show a steady global decline in child poverty since 2013, reflecting sustained progress across regions. They also provide suggestive evidence of an increase in extreme child poverty at the height of the pandemic in 2020, followed by a fall in the rate of extreme child poverty in 2021 and 2022. The impacts of the pandemic are also found by Fiala et al. (2021), which, by using national poverty lines across developing countries, reported that the pandemic increased the number of children living in monetary poverty, with uneven impacts across regions. Despite the progress observed, World Bank (2024a) documented that by 2022, the extreme child poverty rate was still more than twice the rate of adults (16.8 versus 6.6 percent).
This paper contributes to this literature by providing an updated picture of global and regional trends in child poverty. It incorporates the largest vintage of data available to date, including over 80 survey data points for the post-COVID-19 period. This work also reflects the World Bank’s updated international poverty lines to monitor global poverty based on the International Comparison Program’s 2021 PPP adopted in June 2025 (Foster et al. 2025). Finally, the study complements the trends observed at the global and regional levels with an analysis of national trends. This allows a clearer understanding of the heterogeneity of paths in the progress toward child poverty eradication.
The fact that the estimates in this note reflect the most recent collection of household surveys available for poverty monitoring carries an important implication. Namely, the estimates in this note differ from those presented in Salmeron Gomez et al. (2023). The new data vintage used in this paper includes the addition of over 90 new country-years of survey data (Alfani et al. 2025). Crucially, this vintage incorporates new survey-based poverty estimates for India.5 The availability of new data provides a clearer picture of global poverty than before, as more recent data give the double benefit of replacing projections but also helping improve the forecasting power of the models used to project poverty rates whenever data is missing. Meanwhile, the adoption of the 2021 PPP factors and the concurrent upward revision of the international poverty lines led to revisions to poverty rates in several countries.6 Notwithstanding these changes, the overall global and regional trends in child poverty found in this study largely reflect those in Salmeron Gomez et al. (2023) though the rates of monetary poverty are higher than previous estimates suggested.
Methodology and data
Following Salmeron Gomez et al. (2023), the methodology to calculate child poverty rates is based on a three-step procedure. The analytical starting point is the collection of survey data that provide microdata for all the countries available in the World Banks’ Poverty and Inequality Platform (PIP) and that have been estimated for the “line up” year 2023.7 From this collection of microdata, two more data sources are used to estimate child poverty rates. One is a yearly panel of country-level poverty rates for 2014 to 2024. This panel is a collection of poverty rate estimates and projections produced by the World Bank as part of the June 2025 Global Poverty Update (Alfani et al. 2025). Poverty rate estimates for the international poverty line of $3.00 (2021 PPP) and the poverty line of $8.30 (2021 PPP) are data-based whenever a survey is available and has been harmonized in the Global Monitoring Database (GMD) – the World Bank’s repository of household surveys with data on income, consumption, and sociodemographic characteristics. Poverty rate projections are used whenever survey data for the period of interest (2014-2024) is not available. The methodology to forecast and back cast is described in detail in World Bank (2025f). The final sources of information used to estimate the child poverty rates are the population projections from UNDESA.8 In particular, the country-level population estimates by age and gender for each year of 2014 2024 are used.
Starting from each set of microdata available in the ‘line up’ year, the extreme child poverty rate is estimated as follows.9 First, using the information from UNDESA, the sampling weights of the microdata for each country are adjusted to replicate the population’s age-gender distribution in each year of interest. Second, the (per capita) welfare distribution is used to identify the percentile that would correspond to the national level extreme poverty rate available in the panel dataset. Households with a welfare per capita below that identified percentile are considered poor in that year. Thus, poor children are identified as those residing in households considered poor and the corresponding child poverty rates are calculated.
While national-level poverty projections are available for over 170 countries, this study includes a total of 152 economies. The difference is because the GMD lacks information on several high-income countries, for whom information is only available as grouped (i.e. not individual-level) data; or the data on individuals’ age was not readily available.10 The total population of children covered in this analysis is 2.15 billion. Finally, regional analyses are constructed using the regional classification in UNICEF (2023).
There are important limitations in terms of data that should be noted. The gaps between the survey years and the lineup year may impact the uncertainty around the estimations. From the 152 countries in the data, 85 have a survey collected less than three years away from 2023 (i.e. in the post-COVID-19 era), but for 60 economies the survey used in the lineup was pre-COVID-19 while 9 of them had surveys 10 years older than the lineup year. There are region-specific limitations as well. In the MENA region, there are 9 countries included in the analysis: the Arab Republic of Egypt, the Islamic Republic of Iran, Iraq, Jordan, Lebanon, Morocco, Tunisia, the West Bank and Gaza, and the Republic of Yemen.11 These countries have at least one household consumption survey available for the calculations. However, of the nine countries, four conducted two or more surveys between 2014 and 2024, three conducted only one survey during this period, and two did not conduct any, relying instead on projections derived from pre-2014 surveys. The sample includes 45 countries from Sub-Saharan Africa. However, nearly half of these countries conducted only one survey during the 2014–2024 period. In most cases, these surveys were carried out before the onset of the COVID-19 pandemic. Thus, for many countries, poverty rates during the period of interest will reflect mostly projections, as opposed to estimates based on survey data.
Global child poverty trends
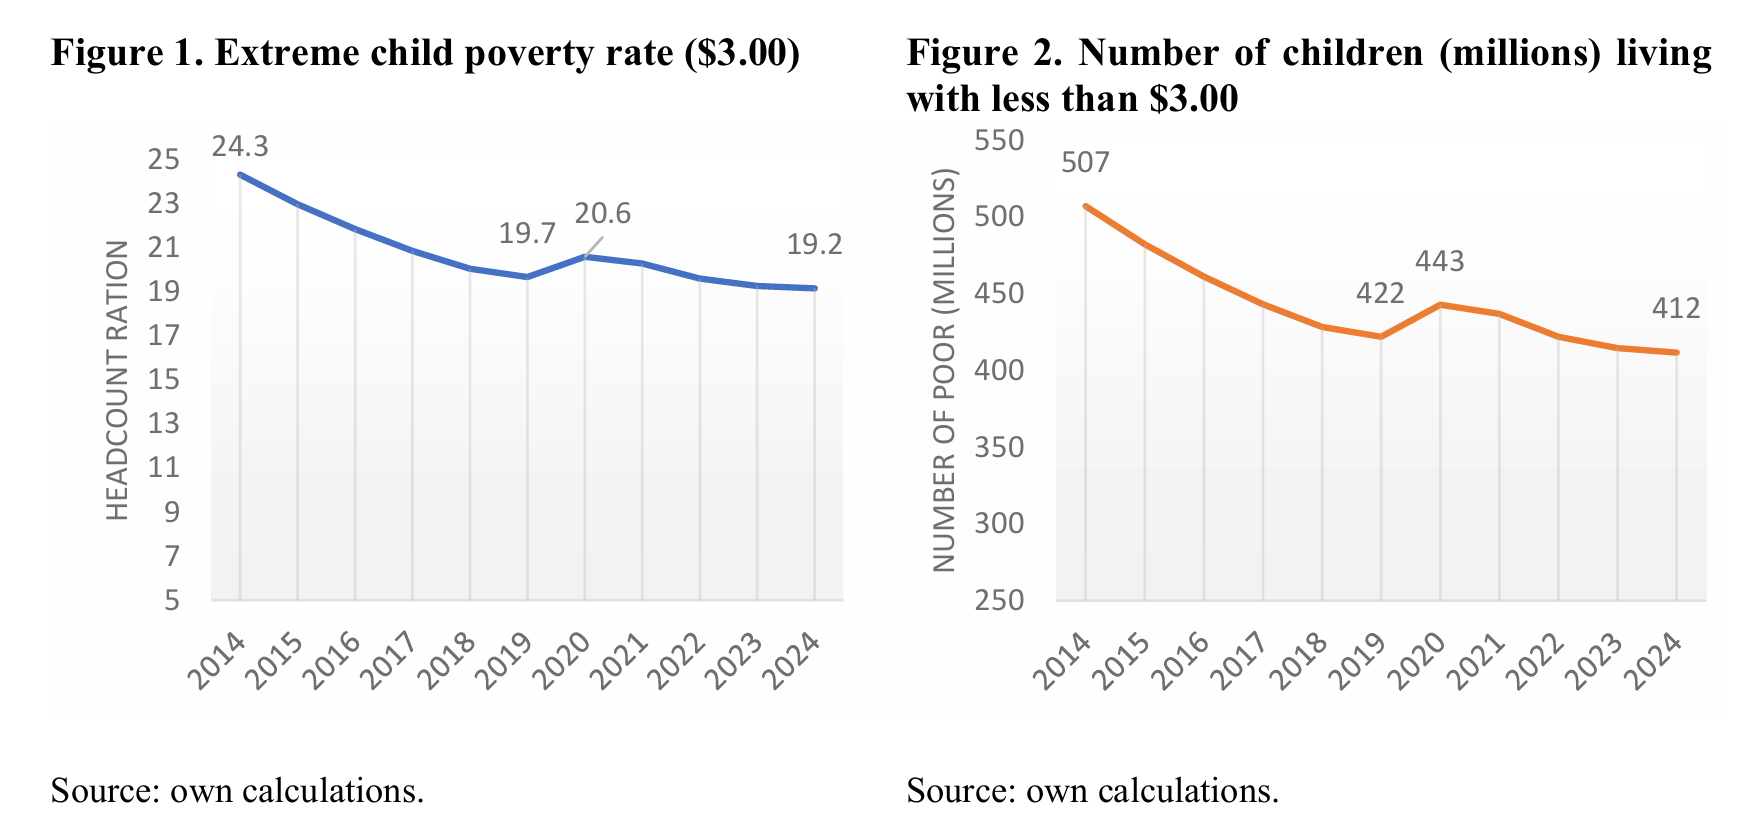
Extreme child poverty (using a $3.00 2021 PPP per day threshold) Global poverty monitoring estimates show that 19.2 percent of children 17 years and younger, approximately 412 million children, lived in extreme poverty in 2024 (measured with the $3.00 per day poverty line in 2021 PPPs; see Figure 1). While lower than the estimate for 2014 (24.3 percent), we find suggestive evidence that only in 2022 did child poverty rates recover to pre-COVID-19 pandemic levels around two years of lost progress. Still, the latest estimate confirms that extreme child poverty has been on a downward, albeit slow paced, long-term trend.
This real progress is welcome, but other indicators show there are still significant challenges. The extreme child poverty rate in 2024 is much higher than the 11.2 percent extreme poverty rate of the overall population, or the 7.6 percent rate among the adult population.14 Children continue to be disproportionately represented among the extreme poor: children comprise more than 50 percent of those in extreme poverty although their share of the global population is around 30 percent.
The number of children in extreme poverty decreased from 507 million in 2014 to 422 million in 2019 before spiking during the 2020 pandemic to 443 million (Figure 2). Since then, the number of children living in households with less than $3.00 per person per day (2021 PPP) has declined slowly, reaching 412 million in 2024.
Unfortunately, progress in extreme child poverty is starkly different in Fragile and Conflict-Affected States (FCS). There are 31 economies considered FCS according to the World Bank classification in 2024 (World Bank 2025d). Looking at the trends in extreme child poverty is worrisome: in 2014 the rate in FCS was 46 percent while in 2024 it had reached 50.2 percent – roughly the same level as in the first year of the pandemic (49.5 percent). In non-FCS countries, extreme child poverty rates followed a downward path from 19.9 to11.4 percent in the 2014-2024 period, only interrupted by the increase in poverty observed in 2019-2020 (from 13.4 to 14.0 percent), which was eliminated by 2021 (13.3 percent). These results imply that there has been an increasing concentration of children in extreme poverty in FCS. Based on the projections of this paper, the share of children in extreme poverty living in FCS increased from 32.1 percent to 52.5 percent in the 2014-2024 period.
Child poverty (using the $8.30 per day 2021 PPP threshold)
The poverty line of $8.30 shows a more dire situation. Based on this higher benchmark for child poverty, the rate in 2024 was 65.9 percent, just over 7 percentage points below the estimate of a decade ago (73.1), representing about 1.4 billion children living below this standard. Despite recovering quickly in 2021 from the ground lost during the 2020 pandemic, this achievement is still overshadowed by the large share of children living below this earnings threshold.