Overview
This year’s report provides the external sector assessment of 30 of the world’s largest economies on the basis of their 2024 data.
Global current account balances in 2024 widened significantly. Staff assessment suggests that excess current account balances account for about two-thirds of the widening, with China, the United States, and the euro area driving the increase.
As the first in a planned series of periodic monitoring of the international monetary system, Chapter 2 takes stock of historical developments, outlines key conceptual frameworks, and introduces new indicators to track its evolving trends.
EXTERNAL POSITIONS AND POLICIES
This overview chapter discusses the evolution of current accounts and other external sector developments in 2024 and summarizes IMF staff external sector assessments for the medium term on the basis of the 2024 information, with detailed country assessments presented in Chapter 3. The forward-looking part of this opening chapter analyzes key risks affecting global current account balances and dis cusses policy priorities for promoting external rebalancing.
External Sector Developments in 2024 Current Accounts
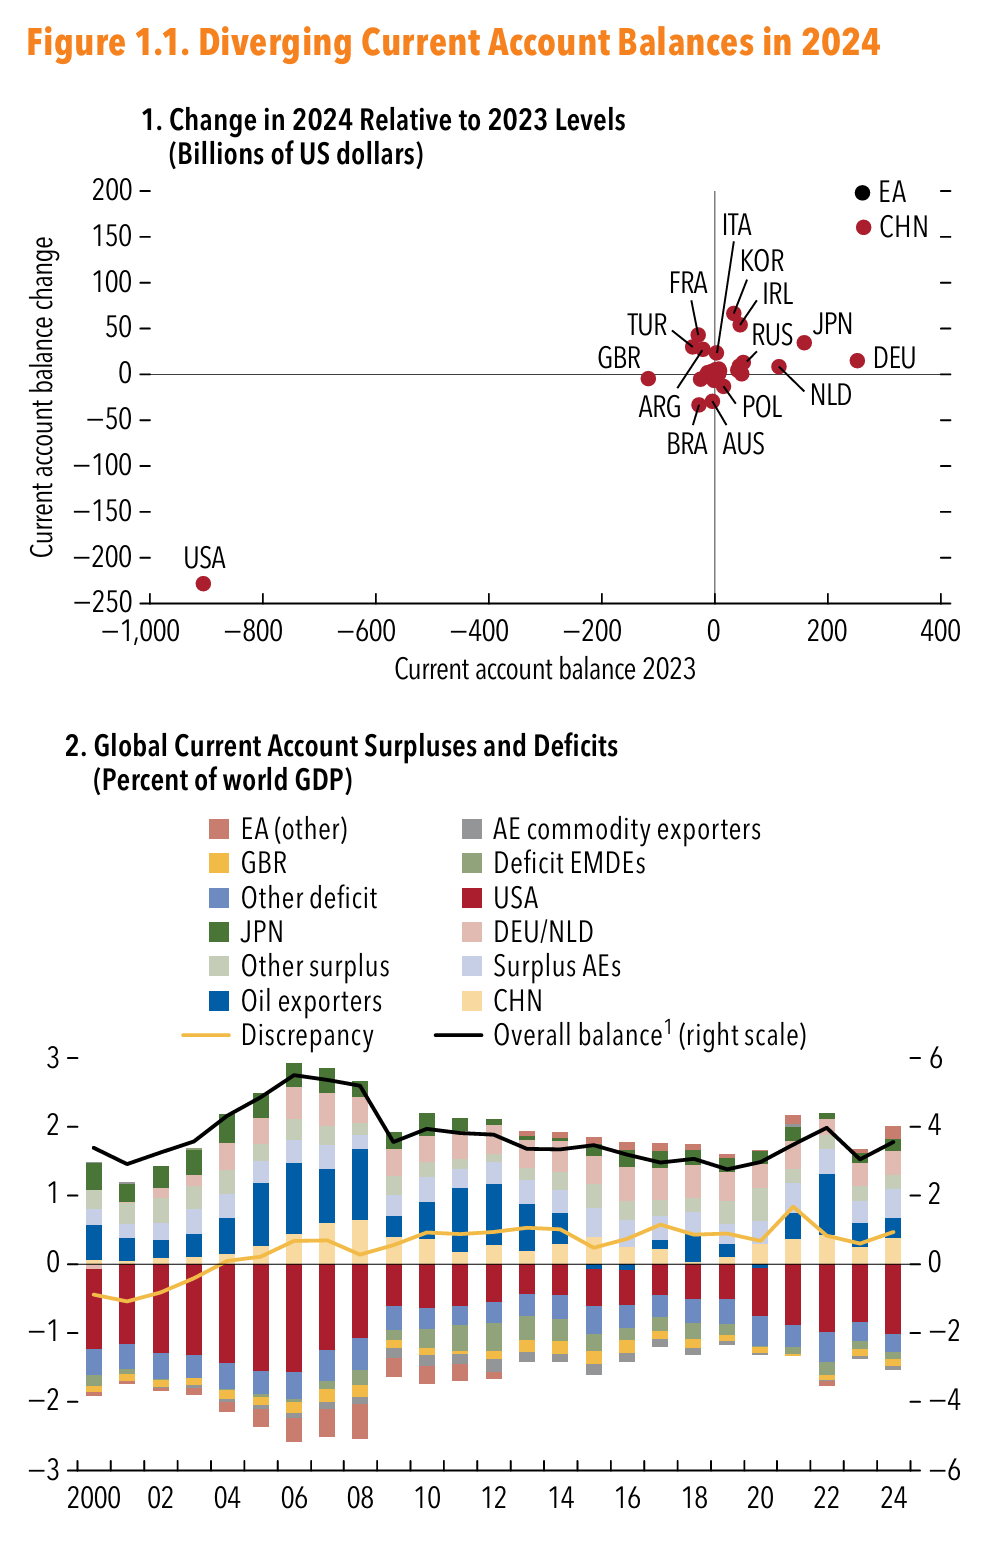
Current accounts of major economies diverged significantly in 2024. The deficit in the United States widened by $228 billion to $1.13 trillion (1.0 percent of world GDP). Meanwhile, surpluses in China and the euro area increased by $161 billion to $424 billion and by $198 billion to $461 billion, respectively. Within the euro area, current accounts increased in all large member states, while Ireland provided the largest contribution to the increase in the surplus (Figure 1.1, panel 1). Among other major economies, surpluses increased in Japan and Korea, and deficits widened in Brazil and Australia. Overall, of the 30 countries covered in the External Sector Report (ESR), 22 reported widening current account deficits or sur pluses (Table 1.1).
Global current account balances widened by 0.6 percentage point of world GDP. Major economies drove the widening global current account balances in 2024. Contributions from China and advanced economies accounted for most of the increased global current account surpluses, which were matched by an increased US contribution to global current account deficits (Figure 1.1, panel 2). Global balances widened despite a decline in oil exporters’ current account surplus, reflecting lower commodity prices in 2024.1 The negative contribution from oil-exporting countries in 2024 is notable, because this country group con tributed significantly to all previous major widening episodes, including during 2003–06 and 2021–22.
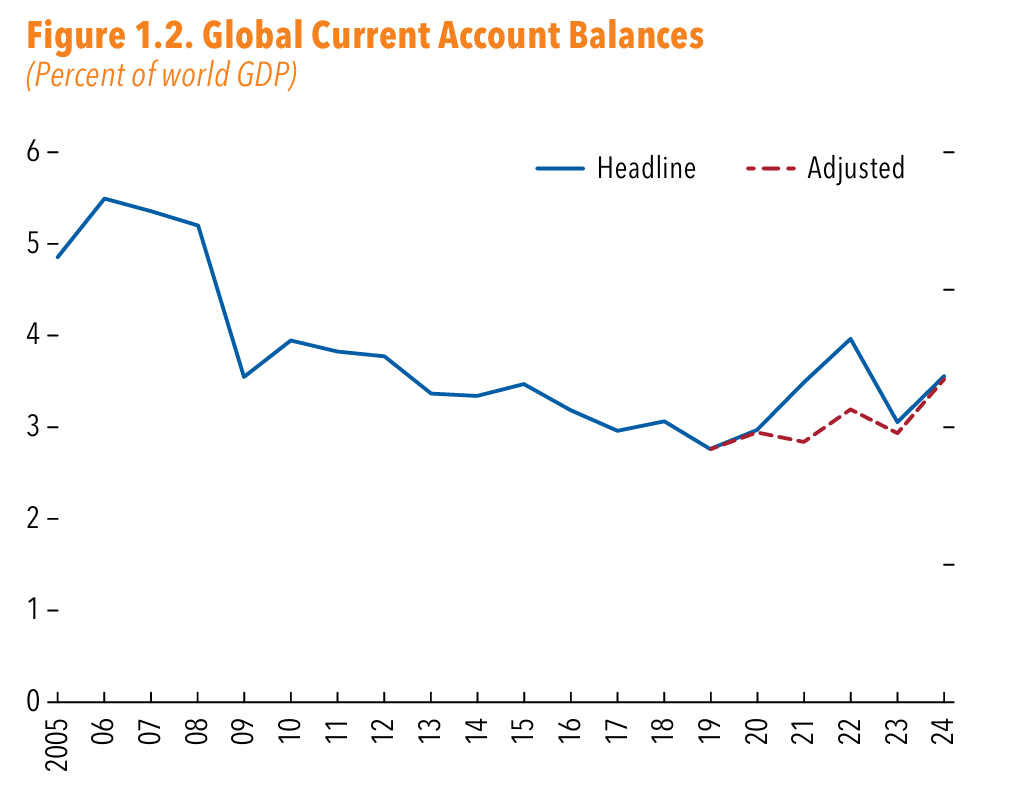
The widening in global balances in 2024 might signal a shift in the underlying trend. The historical significance of this widening is partly obscured by the external sector volatility during 2020–22, stemming from the COVID-19 pandemic and the spike in com modity prices. Once these events are adjusted for, two key findings emerge (Figure 1.2 and the note). First, the contributions of the pandemic and Russia’s war shocks to global balances fully receded by 2023.2 Sec ond, 2024 saw the largest increase in global balances since the pre-Global Financial Crisis boom, halting the downward trend that prevailed in the aftermath of the Global Financial Crisis.
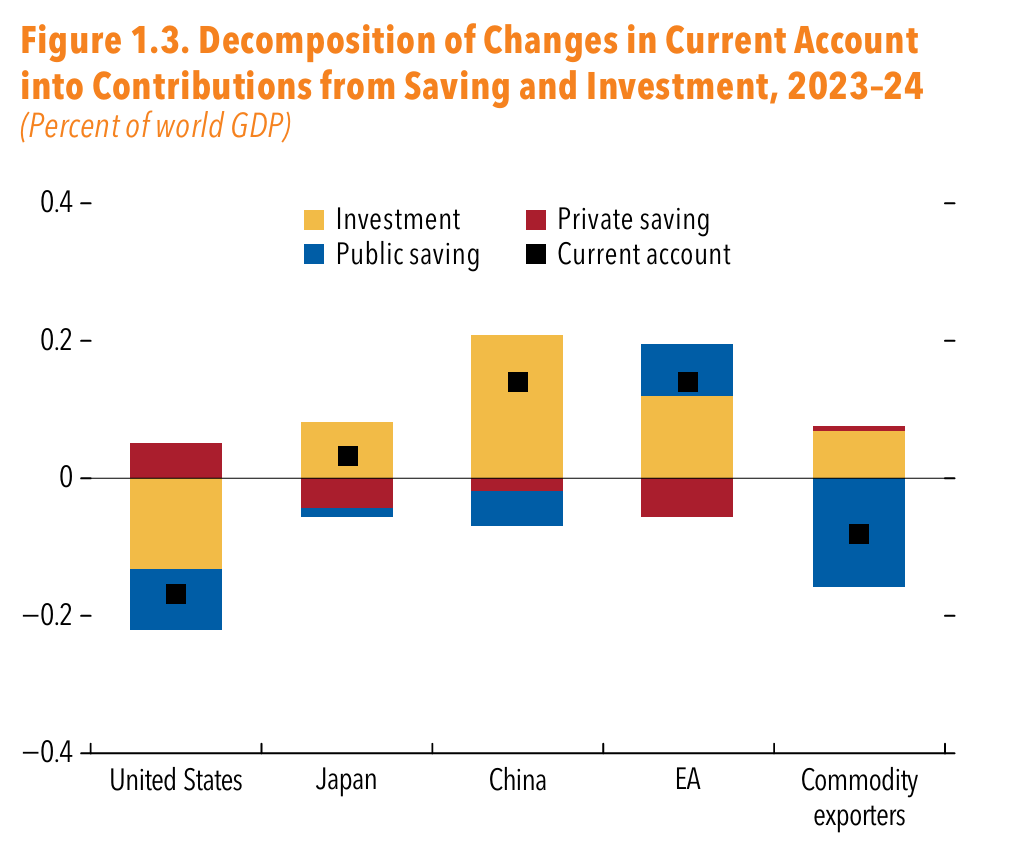
Domestic macro imbalances—due to structural factors, cyclical conditions, and policies—drove the widening global balances in 2024. Saving-investment decomposition of the current account changes in key economies sheds light on these developments (Figure 1.3). Changes in investment rates uniformly contributed to widening saving-investment gaps, with an increased investment rate in the United States widening the current account deficit, and a decrease in key surplus regions (China, the euro area, and Japan) expanding the surpluses. These changes in investment partly reflect divergent domestic demand conditions in 2024 relative to 2023: continuing real estate cor rection and weaker demand in China, deteriorating conditions in the euro area, and strong growth in the United States. Changes in medium-term growth prospects and productivity trends also contributed to these investment trends, with stronger productivity growth in the United States, in contrast to decelerat ing productivity growth projected in surplus advanced economies and China (2025 April World Economic Outlook). The divergence in investment rates was accommodated partly by changes in private saving, which are estimated to have increased in the United States and decreased in the surplus countries—China, euro area, and Japan. However, in all cases, private sav ing compensated for only 10 percent to 50 percent of the investment change. Meanwhile, change in public saving magnified domestic imbalances through dissa ving in the United States and higher public saving in the euro area, while contributing to narrowing domes tic imbalances in China. With temporarily compressed commodity prices, commodity exporters smoothed the negative impact on income by decreasing public saving, thus running smaller current account surpluses relative to 2023.
Sources: IMF, World Economic Outlook database; and IMF staff calculations.
Note: Data labels in the figure use International Organization for Standardization country codes. AE = advanced economy; EA = euro area; EMDE = emerging market and developing economy. 1Overall balance is the sum of absolute values of current account surpluses and deficits. AE commodity exporters comprise Australia, Canada, and New Zealand; deficit EMDEs comprise Brazil, Chile, India, Indonesia, Mexico, Peru, South Africa, and Türkiye; oil exporters comprise World Economic Outlook definition plus Norway; surplus AEs comprise Hong Kong SAR, Korea, Singapore, Sweden, Switzerland, and Taiwan Province of China. Other deficit (surplus) comprise all other economies running current account deficits (surpluses).
Sources: IMF, World Economic Outlook database; and IMF staff calculations.
Note: “Adjusted” series removes from the 2020–24 headline global current account balance the impact of (1) COVID-19 pandemic factors as identified in Figure 1.3 of the 2024 External Sector Report, and (2) commodity price fluctuations, identified by removing fluctuations in “oil exporters” group’s current account balances relative to the group’s average surplus over the preceding decade. Oil exporters comprise World Economic Outlook definition plus Norway.
Sources: IMF, April 2025 World Economic Outlook; and IMF staff calculations.
Note: The estimated changes in contributions include the impact of changes in countries’ shares in world GDP, including because of exchange rate effects. Investment is displayed as a negative value. The private saving rate is calculated as the residual from the current account balance, investment, and the public saving rate. EA = euro area.
Sources: Consensus Economics; Organisation for Economic Co-operation and Development; IMF, World Economic Outlook database; and IMF staff calculations.
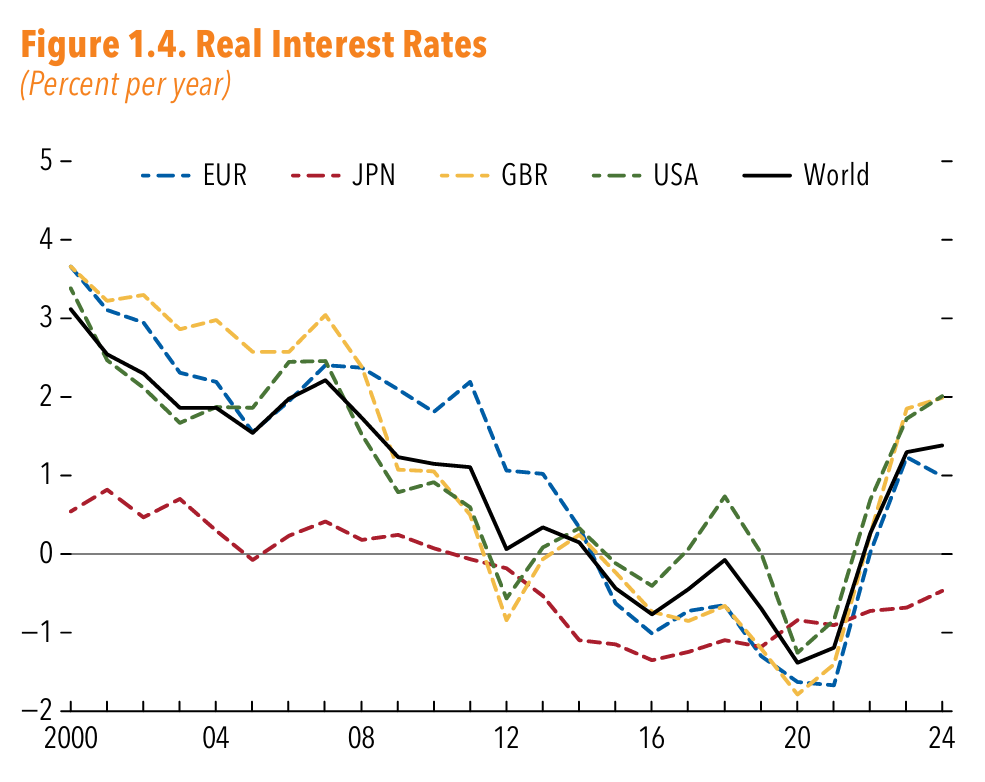
Note: Real interest rates are calculated using nominal 10-year government bond yields and long-term inflation expectations from Consensus Forecasts. World real interest rate is calculated as average of EUR, GBR, JPN, and USA, weighted by GDP weights adjusted for purchasing power. Data labels in the figure use International Organization for Standardization country codes.
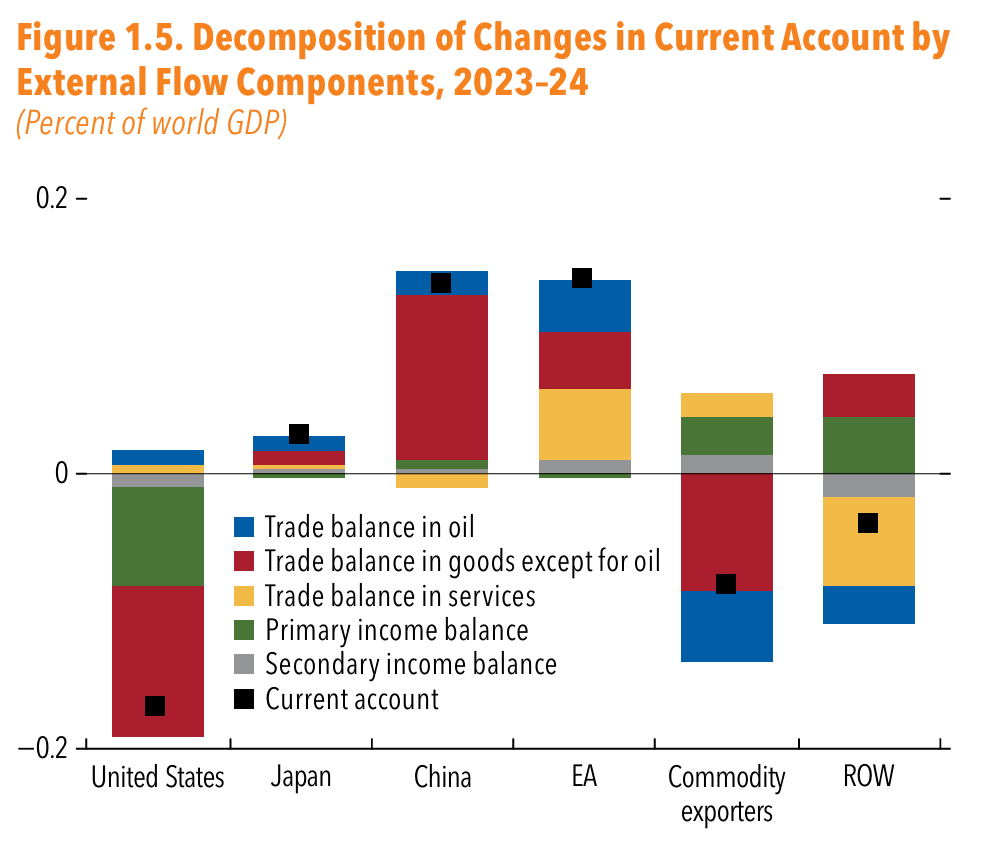
Sources: IMF, April 2025 World Economic Outlook; and IMF staff calculations.
Note: The estimated changes in contributions include the impact of changes in countries’ shares in world GDP, including because of exchange rate effects. EA = euro area; ROW = rest of the world and statistical discrepancy for each balance of payment component.
Global real interest rates remained stable in 2024, with excess saving in key surplus countries matched by dissaving in deficit countries. Globally, both invest ment and saving decreased as a share of GDP. Con currently, global real interest rates remained broadly stable in 2023–24 (Figure 1.4). A key implication is that broadly offsetting drivers of saving and invest ment were behind the increase in global current account balances in 2024. Weak domestic demand in China and the resulting excess saving were broadly matched by the dissaving in the United States. These underlying drivers of widening global current account balances have so far had more muted global effects than in the years leading up to the global financial crisis, when excess global saving contributed to the widening global balances and declining global interest rates (April 2023 World Economic Outlook, Chapter 2; Bernanke 2005; Caballero, Farhi, and Gourinchas 2008, 2016, 2017a, 2017b, 2021). Persistently elevated real interest rates since 2023 could mark a break from previous trends, after a large decline in the past 20 years.
Among external flows, diverging trade balances for goods contributed the most to the widening global current account balances. In the United States, expansion of the trade deficit in goods accounted for 63 percent of the decrease in the current account, with a surge in imports of goods driving the widen ing deficit (Figure 1.5). A reduction in the primary income balance accounted for the remaining increase in the deficit. In China, 87 percent of the current account increase came from a stronger goods balance, underpinned by a weakness in imports reflecting deteriorating domestic demand and a surge in exports potentially reflecting stronger foreign demand or excess domestic supply (Rotunno and Ruta 2024; Garcia-Macia and others, forthcoming). In the euro area, an increase in the services balance contributed sizably, partly because exports of intellectual property from Ireland were unusually high. An increase in the goods balance was significant, mainly resulting from an improved trade balance for oil, reflecting lower energy import prices and broadly offset by corresponding reduced surpluses for oil exporters. The “rest of the world” group also played a significant role and was the main counterparty to the primary income deficit in the United States and the service trade surplus in the euro area.3 With increasingly complex cross-border transac tions in trade and finance, these balance-of-payments external flow components, including trade balance in goods and primary income balance, can contain significant measurement errors, which could impact headline current accounts and global balances (see Box 1.1).
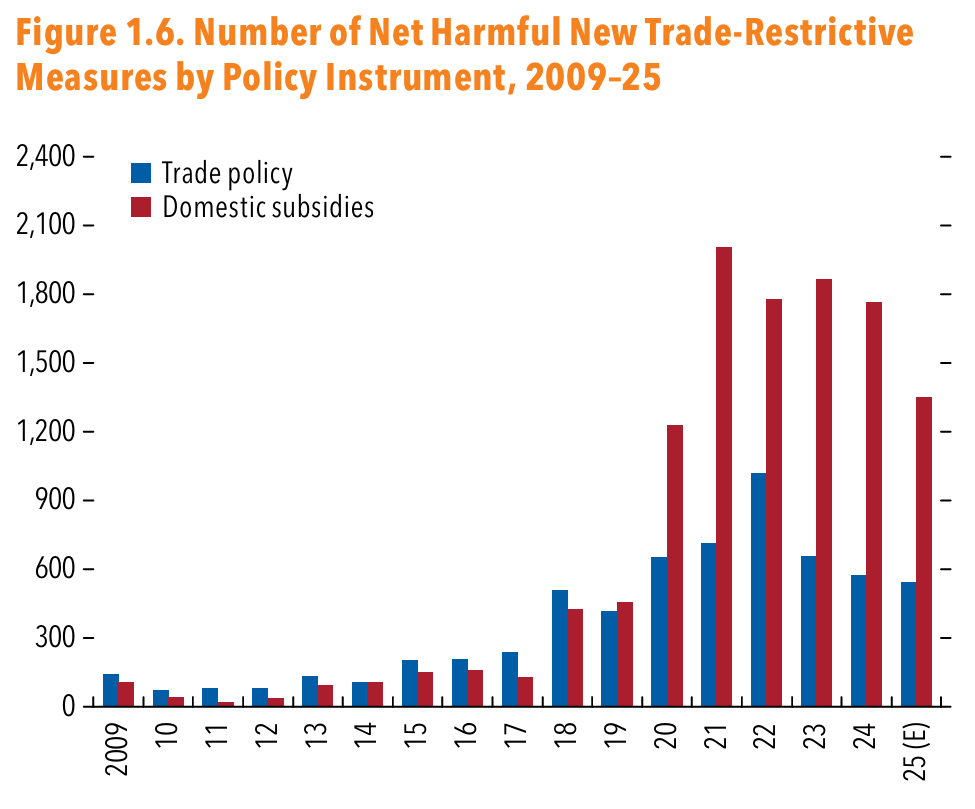
Sources: Global Trade Alert database; and IMF staff calculations.
Note: Domestic subsidies policies are those non‐tariff measures interventions cataloged in Chapter L by the classification adopted in UNCTAD (2013). Trade interventions are those cataloged as tariff measures or under chapters B–E, I, M, P, or D in UNCTAD (2013). Net new interventions are counted each year. The reported time series is adjusted for time-series comparison. The year 2025 reports expected interventions, using implemented interventions until May 21, and linelay interpotlating them for the rest of the year. Net interventions are the number of harmful (red) minus liberalizing (green) interventions as published in the Global Trade Alert database. Results are based on data published on May 22, 2025. E = Estimate.
State interventions and other non-market policies and practices affect trade flows, but the impact on aggregate external imbalances is harder to quantify. The number of new policy measures restricting trade continued to accumulate during 2024 at a high pace (Figure 1.6), with their effective size accelerating in 2025 (Figure 1.27). Data from the Global Trade Alert show that between 2009 and 2022 new restrictions have increased rapidly in the United States and euro area, though from low levels. Over the same period, China accounted for about two-thirds of all sub sidy measures adopted by G20 advanced economies combined (IMF 2024, Box 7; Gourinchas and others 2024). Rotunno and Ruta (2024) find that subsidies of products in China can have a small but non-negligible impact by expanding exports and suppressing imports, thus potentially contributing to external imbalances. However, the impact on aggregate trade balance remains unclear. A lack of up-to-date and comprehen sive data on subsidy policies in many countries hinders further analysis of their role in driving current account imbalances in 2024.
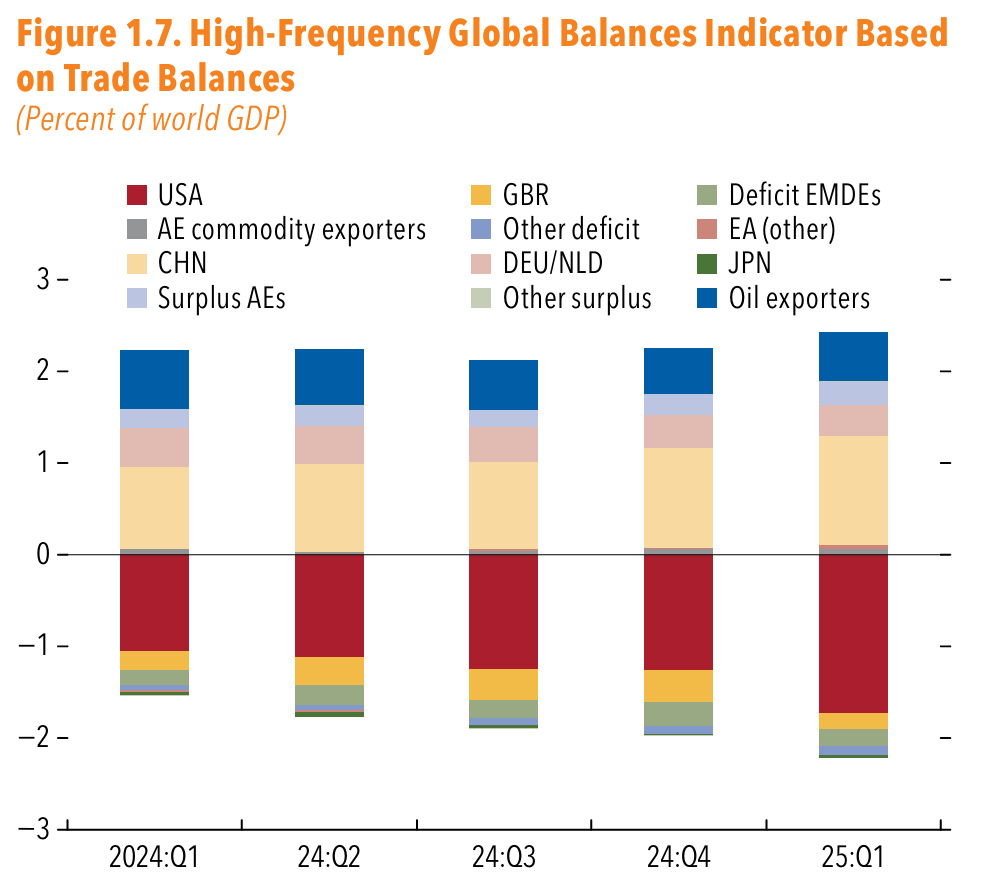
Sources: IMF, World Economic Outlook database; national statistical offices; and IMF staff calculations.
Note: Data labels in the figure use International Organization for Standardization country codes. AE = advanced economy; EA = euro area; EMDE = emerging market and developing economy.
Early data for 2025 signal highly volatile external balances. Monthly merchandise trade flows data from customs for January-March show a large increase in the US deficit, countered by an expanded surplus in China (Figure 1.7). This likely reflected consumers and businesses frontloading trade in anticipation of tariff increases, and gold imports for the United States. The temporary nature of such activities could signal more volatility going forward.
Source: Haver Analytics. 23:Q1 23:Q3 24:Q1 24:Q3 25:Q1
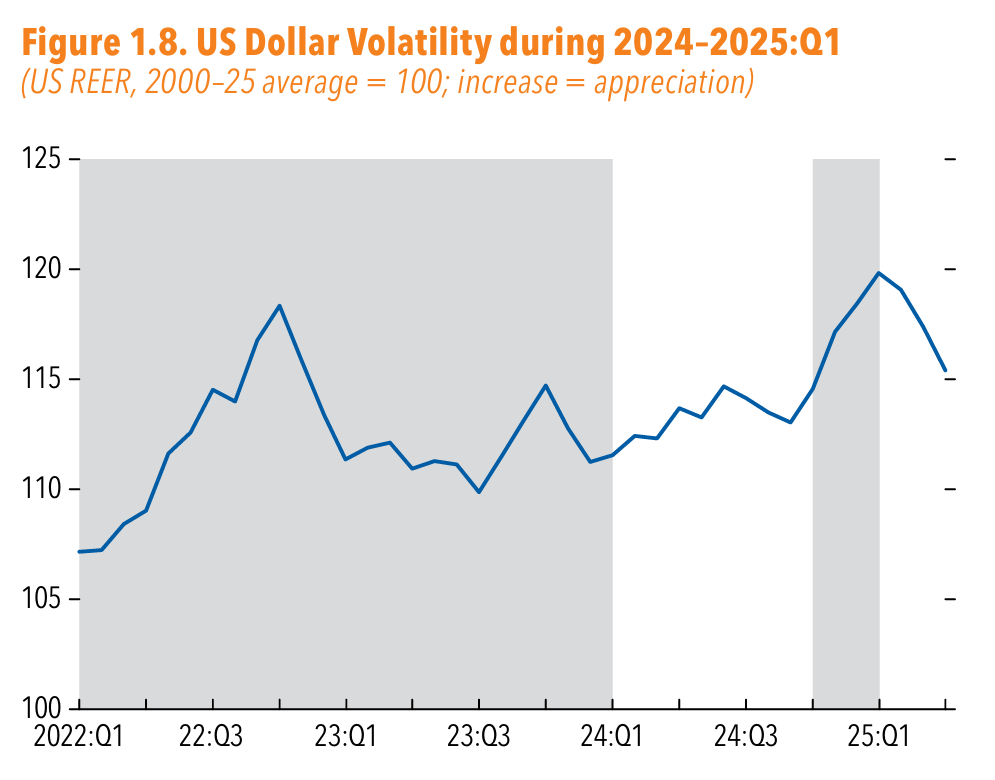
Note: Shaded areas indicate pre-2024 period and 2024:Q4. REER = real effective exchange rate.
Currencies, Financial Flows and Balance Sheets
Exchange Rates
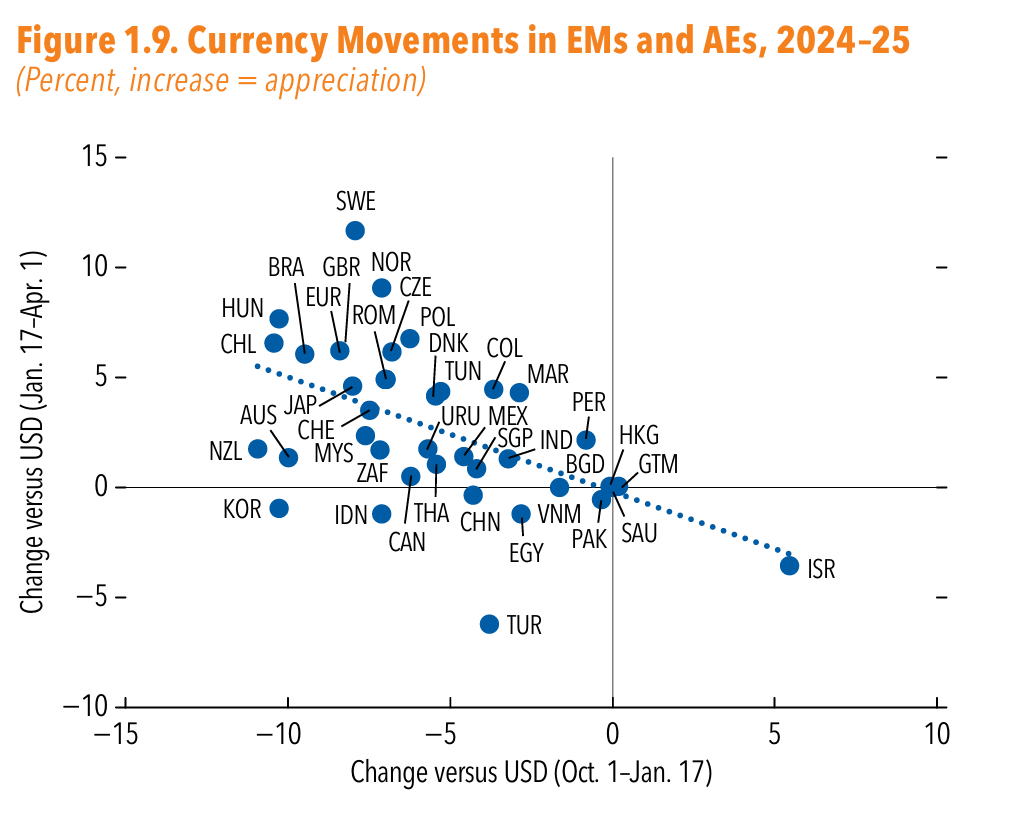
The US dollar hit a historic high in 2024, followed by a depreciation amid rising uncertainty in 2025. During the first three quarters of 2024, the US dollar was broadly stable at 13 percent above the post-2000 average (Figure 1.8). The limited appreciation in effec tive terms during this period (1.3 percentage points), was entirely due to appreciation against the Mexican peso. In the fourth quarter of 2024, as the US presi dential election came into focus, the US dollar appre ciated sharply against all major advanced economy and emerging market currencies (x-axis in Figure 1.9). By the end of the year, the US dollar reached its high est since September 1985 in real effective terms, at 18.5 percent above the post-2000 average. The surge reflected broad-based optimism about the strength of the US economy, favorable terms-of-trade develop ments, and still tight monetary policy. After peaking in January, the US dollar depreciated sharply in the first quarter of 2025, reversing the broad-based appreciation in the fourth quarter of 2024. The depreciation was attributed to weaker economic growth prospects for the United States amid tariff hikes and policy uncer tainty. Currencies that depreciated more in the fourth quarter of 2024 tended to appreciate more in the first quarter of 2025 (Figure 1.9). Despite the depreciation, as of April 2025, the US dollar remained at 15 percent above its post-2000 average value.
Source: Haver Analytics.
Note: Currencies are of countries in the External Balance Assessment model sample. Argentina and Russian Federation were ommitted. Data labels in the figure use International Organization for Standardization country codes. AE = advanced economy; EM = emerging market.
Other reserve currencies had diverse movements in real effective terms. The nominal exchange rate of the Chinese renminbi has been broadly stable against the US dollar, thus the adjustment in the real exchange rate is through relative prices. The currency continued to depreciate in 2024 (2.3 percent) and the first quar ter of 2025 (1.6 percent), reflecting lower inflation in China relative to its trading partners and extending the cumulative depreciation since 2022 to 13 percent. The Japanese yen depreciated in 2024 by 5.3 per cent, reflecting the yen’s nominal depreciation against major currencies, mainly as a result of continued wide interest rate differentials, but it strengthened by 2.4 percent in the first quarter of 2025. The euro was broadly unchanged, appreciating slightly by 0.6 percent in 2024, relative to 2023, but depreciating by 1.4 percent in the first quarter of 2025. The pound sterling appreciated by 5.3 percent during 2024 and the first quarter of 2025, driven primarily by nominal exchange rate appreciation, as interest rates remain on average higher in the United Kingdom than across other advanced economies.
In several economies, policy rate changes or adjusted changes in foreign exchange (FX) reserves also contributed to addressing broader exchange market pressure in 2024. In addition to nominal exchange rate movements, exchange market pressure can be cushioned by short-term interest rate changes or adjusted changes in FX reserves, which often reflect FX intervention.4 During the first three quarters of 2024, exchange rate changes were the main outlet for addressing exchange market pressure, especially in countries that experienced significant depreciation pressure, such as Brazil and Mexico (Figure 1.10.1). Adjusted changes in FX reserves also contributed to absorbing both appreciation pressure (Poland, Hungary) and depreciation pressure (Japan, Korea). Monetary policy rates were lowered in 17 of the 24 sample economies but had a smaller impact on addressing exchange market pressure. This reflected both limited easing as inflation proved sticky glob ally and the comparatively low elasticity of exchange market pressure to interest rates in the ESR sample. During the fourth quarter of 2024, the broad based depreciation pressure in emerging market and advanced economies was addressed mostly by exchange rate changes, with notable contributions from adjusted changes in FX reserves in some countries (Brazil, Hungary, India). The contribution from policy rates during this episode was subdued (Figures 1.10.2).
Click to read more