Abstract
This article discusses how to apply computational linguistics techniques to analyze largely unstructured corporate-generated text for economic analysis. As a core example, we illustrate how textual analysis of earnings conference call transcripts can provide insights into how markets and individual firms respond to economic shocks, such as a nuclear disaster or a geopolitical event: insights that often elude traditional non-text data sources. This approach enables extracting actionable intelligence, supporting both policy-making and strategic corporate decision-making. We also explore applications using other sources of corporate-generated text, including patent documents and job postings. By incorporating computational linguistics techniques into the analysis of economic shocks, new opportunities arise for real-time economic data, offering a more nuanced understanding of market and firm responses in times of economic volatility.
Advancements in information technology, coupled with the rapid growth of digitally accessible text, have greatly enhanced economists’ability to use text as data in their research (Baker, Bloom, and Davis 2016; Gentzkow, Kelly, and Taddy 2019). Today, the range of such text sources is virtually limitless, including books, contracts, transcripts, news articles, social media feeds, and many more. Of course, economists have long engaged in analyzing text, as evidenced, for example, by Romer and Romer (1989, 2023), who analyzed historical transcripts of Federal Reserve policymaking meetings. This article focuses on the technological advancements that have transformed this practice. We explore how these innova tions enable faster, larger-scale, and more consistent processing of text, while also facilitating the measurement of multiple textual dimensions.
Specifically, we focus on how analyzing largely unstructured corporate text— produced and utilized daily for decision-making by entrepreneurs and their firms’ shareholders, financial analysts, and other stakeholders—can enhance economic research for academic scholars, policymakers, and corporate management, as well as business and economics students. Traditional quantitative economic research has typically relied on survey data or accounting metrics, such as firms’ profit, investment, or employment figures. The use of text opens up a wealth of new data, offering insights into expectations, perceived risks, costs, and opportunities that are difficult or impossible to extract from conventional data sources.
To illustrate the power of text analysis, we will focus much of this paper on the example of analyzing text from corporate earnings calls, a particularly active area of current research. These calls provide a real-time window into how compa nies respond to unfolding events, offering insights into their strategies, concerns, and expectations. To illustrate, consider Russia’s large-scale invasion of Ukraine on February 24, 2022. Within hours of this escalation, Geox S.p.A., an Italian shoe manu facturer, held its quarterly earnings call. The call focused on the unfolding crisis, with analysts and investors inquiring about contingency plans, revenue dependen cies, and strategic options in light of potential global embargoes, disrupted supply chains, and interrupted interbank communications. Geox was not unique in this regard—management of numerous other corporations engaged in similar discus sions during earnings calls in the following days, anticipating many of the impacts economic policymakers had to confront over the coming years, ranging from high natural gas prices to increased defense budgets. Even beyond geopolitical crises, earnings calls routinely bring policy-relevant issues to the surface. Recent exam ples include ongoing concerns about the dangers of artificial intelligence (AI), the sources of persistent inflation, and trade policy uncertainty.
In this paper, we introduce a set of methods that allow researchers to system atically analyze the content of these earnings calls (and other texts) at scale. These methods enable researchers to measure the risks, costs, and opportunities that firms around the globe attribute to specific shocks, policies, and regulations. Building on these techniques, we show how to trace shock-induced risk transmission and potential contagion across firms, sectors, and regions; and how to measure present and past expectations regarding specific events, such as the 2003 SARS outbreak or the 2017 Tax Cuts and Jobs Act, in this way overcoming the limitations of retro spective surveys that attempt to reconstruct pre-event expectations (Gallemore et al. 2025).1 Moreover, we demonstrate how to make cardinal comparisons of different risks, showing, for example, that in 2023, US-based firms allocated twice as much attention to inflation-related risks than to risks from geopolitics or trade wars— providing insights that are difficult or impossible to glean from other data.
Importantly, the transcripts of these earnings calls are widely available almost immediately, allowing quantitative analysis without the months-long lags typical of accounting or survey data.
Beyond the specific example of earnings calls, we argue that analyzing the full range of corporate text data—including job postings and patents—represents a sea change in our ability to track and understand economic shocks. At a narrow level, discerning why and how firms respond to proposed reforms or technological changes can help shape more effective policy design and facilitate smoother adap tation to economic shocks. On a broader scale, tracing the propagation of supply, demand, and other economic shocks across firms, sectors, and countries is key for testing and refining theories of how the economy functions.
In the subsequent sections, we begin by introducing earnings conference call transcripts as a data source, then outline the building blocks of our approach to creating measures of firms’ exposure to specific shocks using these data. We discuss the options available to researchers in text classification tasks, including keyword-based approaches, the use of “training libraries,” and large language models (LLMs). We then introduce and discuss straightforward techniques that enable the measurement of the risks, costs, and opportunities that decision-makers associate with specific shocks and policies, emphasizing the advantages they provide in terms of cardinal comparisons of risk, differentiating between the effects of bad news versus increased risks, and analyzing the transmission of shocks across coun tries and firms. Finally, we show how to expand these techniques to other corporate text sources, including patents and job postings. We demonstrate how to use these sources to trace the origin and spread of technological innovations across geog raphy, industries, firms, and occupations.
In sum, this article offers a glimpse of how scholars, central banks, think tanks, and international organizations are already integrating text-analysis tech niques for a range of purposes in their research and policymaking. Throughout, we contend that the main frontier of text as data in economic analysis is not in developing more advanced text-analysis techniques, but in making vast, untapped text corpora accessible to scholars, economists, and policymakers (Bae, Hung, and van Lent 2023).
Earnings Conference Calls: A Marketplace of Information
Corporate communication has changed substantially over the past decades. Before 2000, publicly listed firms primarily communicated through accounting numbers. However, these accounting numbers are inherently backward-looking and slow to reflect new information: they document past events, take months to prepare, and incorporate changes into earnings figures only gradually due to accounting principles that prioritize caution. For this reason, firms’ management would typi cally provide more information and context for their accounting disclosures in private conversations with selected journalists, analysts, and investors.
In 2000, the Securities and Exchange Commission (SEC) made this practice illegal and instead required publicly traded companies to share any such context with the general public. While earnings conference calls—held each quarter after the release of a firm’s financial results—were practiced prior to this regula tion, the new requirements for simultaneous public disclosure accelerated their widespread adoption for discussing a firm’s key financial information. This shift made earnings calls the primary channel through which market participants— institutional investors, financial analysts, and individual shareholders alike—could access management’s interpretation of their firms’ performance.
During a typical corporate earnings call, an executive of the firm (often the chief executive officer or the chief financial officer) reviews the firm’s recent financial performance, discusses operational challenges, and outlines any issues that impact the firm’s future prospects. Financial analysts then pose questions during a question and-answer session, prompting further discussion of the company’s strategies. These conversations last up to an hour. They are livestreamed online, and then later tran scribed and made available. Primarily due to this interactive nature, earnings calls offer substantial complementary textual narratives for nearly every set of accounting numbers available through databases like S&P’s Compustat, and provide valuable context and additional information about firms’ current and future situations.2
Economists have historically been skeptical of using information on what economic decision makers say, favoring instead evidence from what they do (choices and behaviors), because of concerns about “cheap talk”—the perception that deci sion makers can spin information or outright lie to gain an economic advantage. Notwithstanding this, we argue that earnings calls are a valuable venue where what participants say is highly informative about economic behavior. Indeed, unlike casual statements or survey responses, communications during earnings calls carry real consequences. For instance, securities law enforces significant penalties for making materially misleading statements, while the scrutiny of sophisticated analysts, who can challenge management’s claims, generates reputational costs for evasive or inconsistent responses (Hollander, Pronk, and Roelofsen 2010; Rogers, Van Buskirk, and Zechman 2011). Perhaps most importantly, market participants have the option (and are known) to follow up and verify statements made during earnings calls by comparing them to the firm’s subsequent behavior (for example, Suijs 2007).
These institutional features distinguish earnings calls from other contexts where talk may be cheap. Understanding this distinction helps in determining when text data will likely offer reliable economic insights. In general, corporate communica tion is most informative when statements involve explicit or implicit costs and can be cross-validated against observable outcomes, and when institutional structures create incentives for truthful communication.
Many international firms, listed on a stock exchange, either conduct their earnings calls in English or provide translations, enabling rapid assembly of directly comparable corpora across more than 12,500 firms from nearly 90 countries. Primary sources for earnings-call transcripts include corporate investor relations websites and public financial platforms like Yahoo! Finance and Seeking Alpha. Commercial data providers, including the London Stock Exchange Group (LSEG) and S&P, standardize and aggregate these transcripts, making them available through insti tutional subscriptions commonly held by universities. The earnings call data used in this paper come from LSEG through NL Analytics, a startup founded by some of the authors of this paper, which offers online tools for earnings call analysis to researchers, central banks, and international organizations.
Decoding Shocks: Exposure, Risk, and Sentiment
Exposure
The time people spend discussing a topic reveals its importance to them—a simple yet powerful insight that opens new possibilities for measuring the impor tance of different topics in corporate communication. This observation becomes particularly valuable in the context of earnings conference calls, where executives have less than an hour to address their most pressing concerns (Matsumoto, Pronk, and Roelofsen 2011). The time constraint creates a natural prioritization: topics that receive more attention in these discussions are, by necessity, those that execu tives and noncorporate participants consider most significant.
This relation between discussion time and importance allows us to calculate a precise measure of firms’ exposure to specific events or issues, which we call “topic exposure.” Specifically, by calculating the proportion of sentences devoted to a particular topic during an earnings call, we can quantify its relative significance to the firm. For example, counting sentences about Russia’s invasion of Ukraine as a percentage of total sentences reveals which firms face meaningful exposure to the conflict and how this exposure compares to other concerns. Extensive audits with human coders strongly support the validity of this classification approach (Hassan et al. 2019, 2023, 2024a, 2024b).
Risk
One application of this idea is measuring the overall risk a given firm faces at a particular moment by calculating the proportion of the earnings-call discussion devoted to risk or uncertainty. While economists define “risk” as the variance of outcomes, participants in earnings calls may use the term more loosely, frequently focusing on adverse scenarios (“downside risk”). To bridge this gap, we construct a comprehensive dictionary of risk-related terms by identifying single-word synonyms of “risk,” “risky,” “uncertain,” and “uncertainty” from the Oxford English Dictionary, excluding only the terms “question” and “questions,” which of course carry a different meaning in earnings calls. This systematic approach yields terms across a spectrum, from those suggesting volatility (“variable,” “variability”), to those indicating upside and downside potential (“chance,” “prospect,” “pending”). This breadth of terms ensures we capture the full range of risks firms face, not just their concerns about adverse scenarios.3
Applying this dictionary to analyze earnings-call discussions yields a firm-level measure of “overall risk”: the percentage of sentences in a given firm’s earnings call that mention a synonym for risk or uncertainty. Figure 1, panel A, shows the average of overall risk across all firms with a US stock market listing. This measure of economy-wide risk reveals distinct trends. During the “Great Moderation,” from 2002 to 2007, risk mentions remained relatively subdued, with fewer than 1.6 percent of sentences containing risk-related terms (Benati and Surico 2009; Galí and Gambetti 2009). The global financial crisis, however, marked a sharp depar ture from this pattern, with risk discussions peaking at 2.2 percent of earnings call content in late 2008. Subsequent spikes emerged during the European sovereign debt crisis of 2011–2012, and risk-related discussions peaked at 2.8 percent during the Covid-19 pandemic.
At this aggregate level, the pattern of risk-related discussions in earnings calls correlates strongly with market-based measures of risk such as the Chicago Board Options Exchange volatility index, known as the VIX. (The VIX reflects the likeli hood of large price swings in the S&P 500 index over the next 30 days, based on prices of stock options.) However, compared to the VIX and other aggregate market-based indicators, a text-based measure offers a distinct advantage: straightforward disaggre gation. Indeed, starting with the firm-level risk-related discussions, we can construct detailed, disaggregated metrics by sector and region (who is perceiving risk), and even analyze risk patterns for specific topics (what is the risk about).
To measure “topic risk,” we calculate the proportion of earnings-call sentences that mention both risk-related terms and a specific subject, relative to the total number of sentences in the call. Figure 1, panel B, illustrates this topic-specific approach by tracing Brexit-related risks discussed by firms around the world (Hassan et al. 2024a). The time-series pattern shows notable spikes in “Brexit risk” that corre spond with key political developments during that period. To illustrate, discussions of Brexit-related risk surged immediately after the 2016 UK referendum vote to leave the European Union. While this initial uncertainty subsided somewhat in 2017, it intensified sharply in the second half of 2018 as the details of Prime Minister Theresa May’s agreement with the European Union became clear, along with the challenges of securing parliamentary approval. The prospect of a no-deal Brexit under the subsequent Prime Minister, Boris Johnson, kept uncertainty elevated through 2019, until Brexit finally took effect on January 31, 2020.
Figure 1
Text-Based Risk
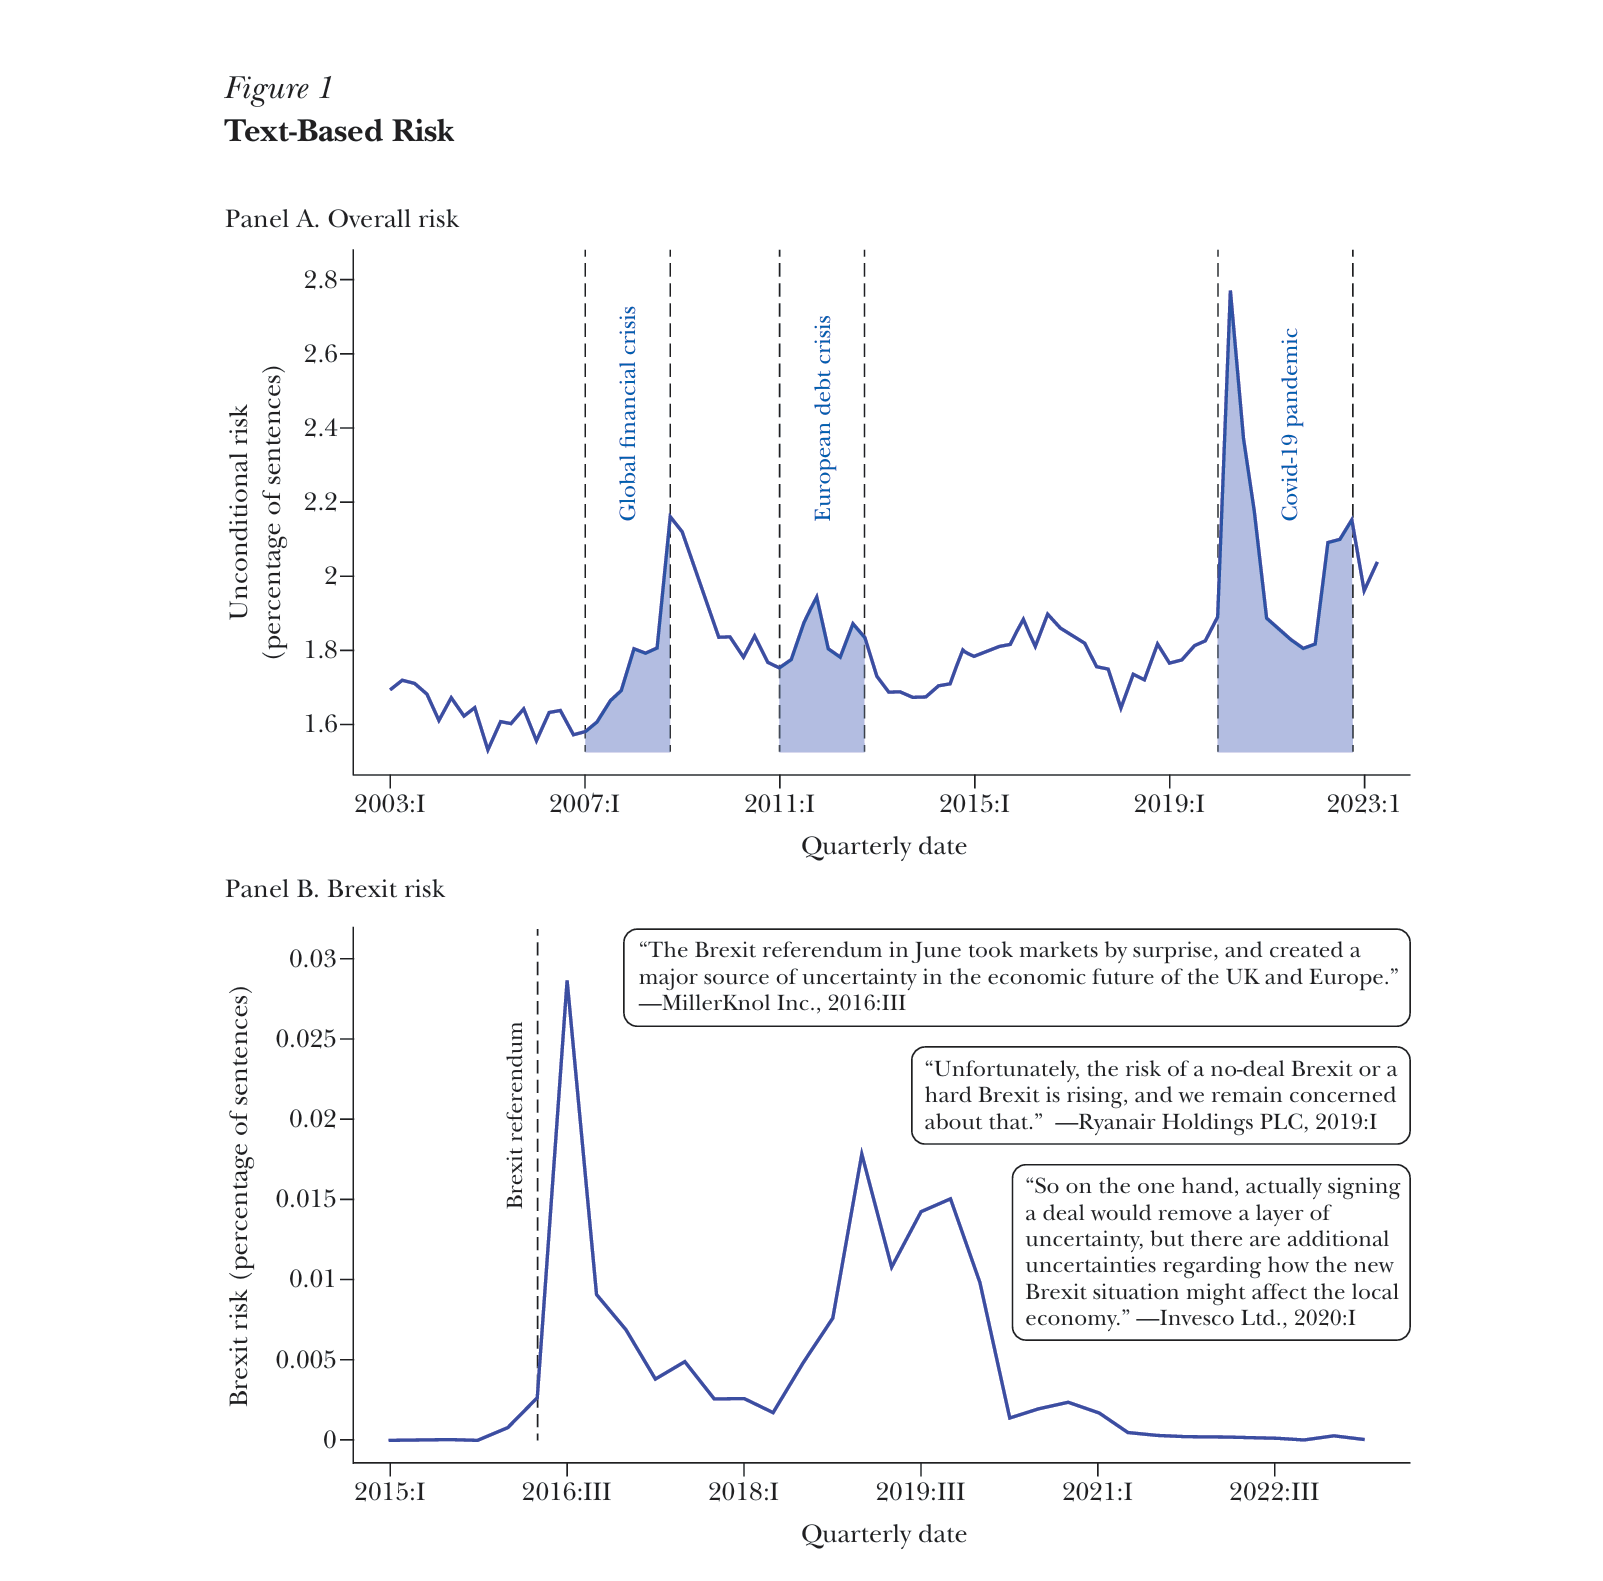
Source: Data sourced from www.nlanalytics.tech.
Note: This figure displays overall risk (panel A) and Brexit risk (panel B) as a percentage of sentences in earnings calls. The sample comprises 379,227 earnings conference calls, representing 12,805 firms headquartered in 89 countries.
By intersecting discussions of risk with discussions of specific topics, we can thus assess how much risk a given firm associates with a given specific topic (such as Brexit).
The figure highlights another key advantage of this text-based measurement approach: its capacity for self-labeling. In other words, the reasons behind observed fluctuations in text-based risk measures become apparent by examining the under lying discussions from the transcripts that contribute to each spike. As the figure illustrates, excerpts from high-scoring earnings-call transcripts enable us to directly link periods of elevated Brexit risk to specific political events and their anticipated economic impacts.
Sentiment
Measuring sentiment from text involves identifying terms that indicate how posi tively or negatively firms discuss specific topics. The most straightforward method to flag earnings-call sentences as positive is if they contain words like “good,” “strong,” or “great” without negative terms, and negative if they include words like “loss,” “decline,” or “difficult” without positive ones. Loughran and McDonald (2011) provide a comprehensive sentiment lexicon specifically calibrated for financial text.
Recent advances in natural language processing allow for understanding words in their full context without relying on specialized dictionaries. However, systematically identifying positive- and negative-toned discussions naturally comple ments the earlier discussion on measuring topics and risk through word frequency. Indeed, similar to how a simple count of topic-specific terms reveals firm expo sure and risk-related terms capture uncertainty, tracking sentiment-related words indicates whether firms perceive economic shocks as having a positive or negative impact. Following this logic, “topic sentiment” counts sentences that mention a given topic with positive sentiment, subtracts the count of those with negative senti ment, and normalizes by the total number of sentences in the call.
Figure 2 shows how topic-sentiment measures capture firms’ responses to major economic shocks. Specifically, panel A compares average sentiment across several significant events: Russia’s 2022 invasion of Ukraine, the Covid-19 outbreak in 2020, Brexit-related developments in 2016, and breakthroughs in artificial intelligence, particularly the release of large language models, in 2023. The measures indicate systematically negative sentiment in discussions related to Brexit, Covid-19, and Russia’s invasion, while discussions related to AI trend positive, with 42.1 percent of sentences related to AI containing positive terms, compared to 10.2 percent nega tive, yielding a net positive sentiment of +32 percent.
These aggregate patterns mask substantial heterogeneity at the firm, sector, and country levels. Panel B shows firm-level variation in discussions related to arti ficial intelligence. Technology firms heavily invested in development of AI, such as Alphabet, NVIDIA, and Microsoft, express strongly positive sentiment. In contrast, content producers like News Corp, Universal Music Group, and Warner Music Group discuss AI with notably negative sentiment, reflecting concerns about intel lectual property protection.4
Figure 2
Text-Based Sentiment
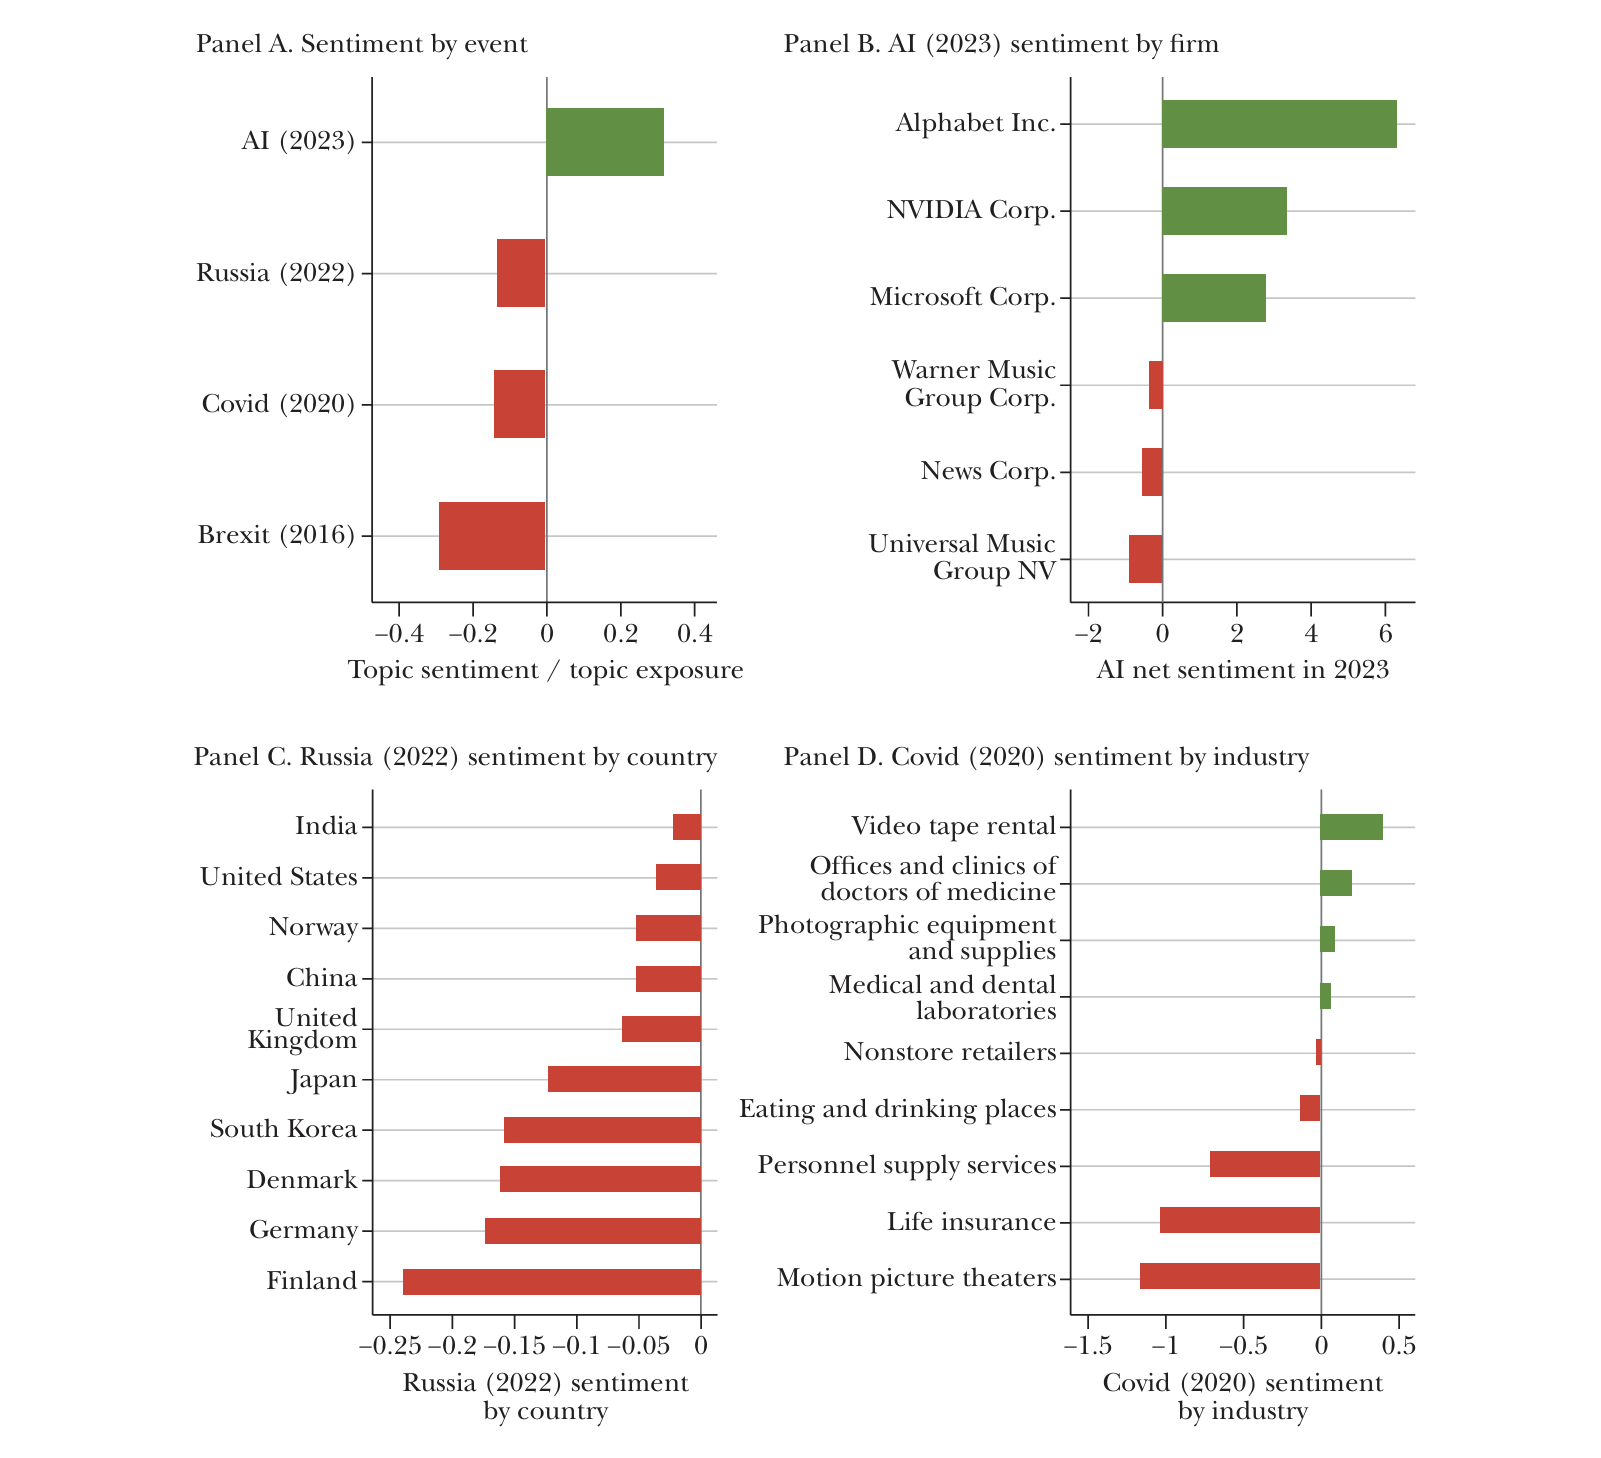
Source: Data sourced from www.nlanalytics.tech.
Note: This figure illustrates topic sentiment as follows: panel A shows topic-specific (namely, Russia (2022), Covid-19 (2020), Brexit (2016), and AI (2023)) sentiment divided by topic-specific exposure; panel B shows AI (2023) sentiment, as a percentage of sentences, by firm; panel C shows Russia (2022) sentiment, as a percentage of sentences, by country; and panel D shows Covid-19 (2020) sentiment, as a percentage of sentences, by three-digit SIC sector. To calculate topic-specific sentiment on the aggregate or by firm, country, or industry, we take an average across earnings calls of topic sentiment where comprises of topic-specific keywords. To illustrate, the topic Russia includes keywords that relate to the country, such as “Russia,” “Russian,” “Ruble,” and “Mr Putin.” Similarly, for the topic of AI, in addition to “AI” and “artificial intelligence” we included terms like “ChatGPT,” “LLM,” “deep learning,” and “machine learning.”
Panels C and D display variation in sentiment across geographic regions and sectors, respectively. Panel C shows that Finnish, German, and Danish firms expressed particularly negative sentiment about Russia-related developments in 2022, with discussions centered on regional security, energy markets, and economic relationships. The transcripts show Japanese and South Korean firms focusing their concerns specifically on trade access through Russian territory.
Even during the same economic shock, sentiment varies substantially across sectors. Panel D shows that early in the Covid-19 pandemic, the Video Tape Rental and Medical Services sectors anticipated benefits, reflecting expected increases in streaming and healthcare demand. In contrast, Life Insurance and Motion Picture Theater sectors projected strongly negative impacts, anticipating increased mortality-related payouts and restricted public gatherings. Collectively, these findings suggest that topic-sentiment analysis is a powerful tool, enabling us to characterize the heterogeneous impact of economic shocks at the firm, sector, and country levels.
One important caveat is that earnings-call language has become more positively toned over time, as executives learned to steer clear of words that might trigger algorithmic trades (Cao et al. 2023). This upward drift inflates raw sentiment, but it is straightforward to purge with time fixed effects.
Lexicon Construction
Each of our measures of topic-specific exposure, risk, and sentiment involves a systematic procedure for identifying sentences that mention a particular topic. For this task, researchers have three options: keyword-based searches, training libraries, and machine learning. These options differ in the degree to which they depend on human judgement, but they all share a common goal: systematically capturing all relevant content (that is, minimizing false negatives), while avoiding spurious mentions (that is, minimizing false positives).
Keyword-Based Approach
The simplest approach to identifying discussions on a given topic is by selecting relevant keywords (Baker, Bloom, and Davis 2016). In our experience, this approach is particularly effective when the topic of interest pertains to a specific, narrowly defined event or policy. For instance, in Hassan et al. (2024a), the single keyword “Brexit” sufficed to accurately capture conversations related to the United King dom’s exit from the European Union. Similarly effective examples include Covid-19, supply chain disruptions, and cyber risk, where a handful of keywords suffice.
The process of choosing keywords usually begins with a set of annotated sentences obtained from human readers, flagging those that discuss the topic of interest.5 Next, we select keywords or phrases that mimic this human classification within the sample of previously annotated text. These keywords or phrases are frequent in sentences discussing the topic of interest and infrequent in those that do not. To check their effectiveness out-of-sample, we sample new sentences from our corpus and assess the rate of false positives. This process may prompt changes to our set of keywords, followed by further sampling and iteration until we identify a set that performs well on our corpus. For example, to identify supply chain-related discussions in Hassan et al. (2023), we started with “supplier” and “supply” and, thus, iteratively built a comprehensive set of keywords.
Training Libraries
For a broader or less precisely defined event or policy, a keyword-based approach can become unwieldy. In such cases, relying on “training libraries” rather than human judgement can be a more effective solution. A straightforward approach in this context is to use the numerical statistic known as term frequency inverse document frequency (Manning, Raghavan, and Schütze 2008; Song and Wu 2008). We apply this approach in Hassan et al. (2019, 2024b) to differentiate between political and nonpolitical risk discussions and to assess the risks firms asso ciate with specific countries.
This approach requires a sufficiently large corpus of text representative of discussions on the given topic. For example, to differentiate between political and nonpolitical discussions, we use two textbooks: one focused on politics and the other on a nonpolitical subject (in our context, we opted for an accounting text book). From these sources, we extract and tally the occurrences of bigrams (that is, two-word combinations), identifying those that are frequent in one training library but not in the other. For example, the bigrams “Joe Biden” and “Congress passed” might be frequent in discussions related to politics, but never or rarely occur in discussions on nonpolitical subjects. This typically results in a list of several thou sands of topic-related bigrams, which are assigned weights proportional to their frequency in the training library.
Compared to a keyword-based approach, training libraries generally capture a much broader range of language used to discuss a topic, allowing for the detection of more subtle and indirect references to the topic in question.
Machine Learning
The third approach leverages machine learning to aid in keyword selection. In this method, the common practice is for a machine learning model to propose keywords to the researcher, who then decides whether to accept or reject them based on how well they align with their definition of the topic in question. For example, Sautner et al. (2023) utilize training libraries to train a machine learning model to distinguish between climate- and non-climate-related discussions in earnings calls.The model then proposes phrases that most effectively make this distinction. For each suggestion, they randomly sample from the text of earnings calls that mention the proposed phrase and accept it if the false positive rate falls below a certain threshold.
In contrast, Kalyani et. al. (2025a) uses a large language model to make sugges tions. To identify job postings for research and development positions, the authors start with a set of seed phrases (for example, “research,” “and develop”) and let the LLM suggest additional phrases commonly used in similar contexts. They then randomly sample excerpts from job postings for each suggestion to check for false positives and include those suggested phrases that meet the threshold for true positives.
A more evolved version of this approach completely delegates the keyword selection-rejection decision to a large language model. In this approach, the researcher provides a verbal description of the topic and allows the LLM to determine whether a given sentence or paragraph from an earnings-call transcript aligns with this defini tion (Jha et al. 2024). The drawback of this fully automated approach, in our view, is that the researcher effectively relinquishes control over the definition of the topic and hands it over to the LLM. This can lead to issues if not handled carefully. One issue is replicability—different LLMs may make different selection-rejection decisions for reasons that are difficult, if not impossible, to interpret afterward. Moreover, particularly when dealing with historical data, LLMs are prone to hindsight bias. For example, an LLM might link “Fukushima” to a nuclear disaster, even when analyzing text from the time before the disaster occurred (Sarkar and Vafa 2024).6
In conclusion, depending on the specific application, a researcher should thoughtfully choose one of the approaches outlined above to build a lexicon. Our experience suggests the virtues of erring on the side of simplicity and opting for a more straightforward approach whenever feasible. Sample code illustrating each approach is available in Hassan et al. (2025b), which can be found at the landing page for this article at the American Economic Association’s website.
Text Analysis Applications in Economic Research
We next present three applications that show how our text-based measures of exposure, risk, and sentiment allow us to track the impact of economic shocks in novel ways that would be hard or impossible to achieve with conventional data. These applications demonstrate how to decompose the relative importance of different risks, separate direct effects from uncertainty impacts, and track the trans mission of shocks across global markets.
Figure 3
Risk Decomposition
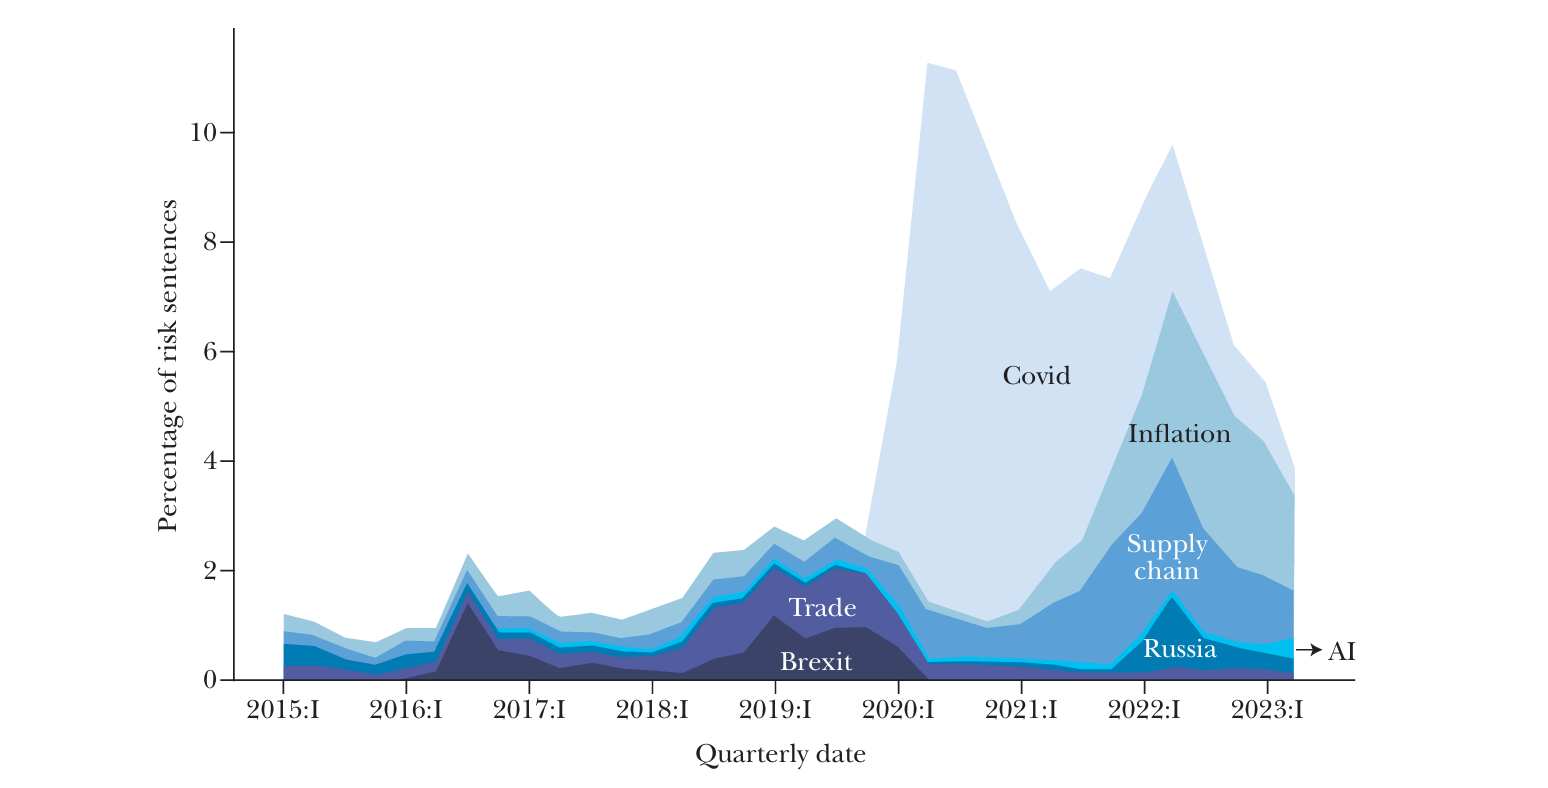
Source: Data sourced from www.nlanalytics.tech.
Note: This figure shows, as a percentage of sentences, a breakdown of risk related to AI, Brexit, Covid-19, inflation, Russia, the supply chain, and trade for our sample of US-listed firms.
Cardinal Risk Decomposition
Our first application illustrates how text analysis facilitates a cardinal comparison of different sources of risk. This approach provides a more precise understanding of how each specific risk contributes to a firm’s overall risk profile and can help policymakers and analysts identify which risks are most pressing.
To fix ideas, note from Figure 1 that in 2016:III, firms devoted 1.90 percent of all sentences to discussing risks and 0.029 percent specifically to discussing Brexit risk. We can thus conclude that Brexit accounted for 1.53 percent of overall risk-related discussions in that quarter. This decomposition of overall risk into specific topics is an important addition to the literature. The closest analog is the attribution of excess returns to risk factors in empirical asset pricing. However, these methods generally do not allow an assessment of which specific shock contributes to the overall uncer tainty faced by a firm at a given time, even when paired with an event study.
Figure 3 applies this decomposition more broadly to track the evolution of different sources of risk over time. The data reveal that trade policy uncertainty reached its peak during the trade war in the first term of the Trump administra tion, representing 0.98 percent of risk mentions in 2018:III—comparable to Brexit-related concerns. The Covid-19 crisis subsequently emerged as the dominant source of risk, accounting for 9.88 percent of the risk-related discussions in 2020:II.As the pandemic’s direct effects subsided, firms’ focus shifted toward inflation and supply chain disruptions. Although Russia’s invasion of Ukraine garnered substan tial media coverage, its effect on firm-level risk discussions was generally limited, with notable exceptions in certain regions. For example, German firms devoted 4.02 percent of their risk discussions to Russia in 2022:I.
This cardinal decomposition provides two key advantages. First, it enables a systematic comparison of the relative importance of different (sources of) risks at any given time, helping policymakers understand which forces are the primary drivers of risk for specific (groups of) firms. Second, the ability to track the evolu tion of these proportions over time allows for the analysis of how the importance of different risk sources rises and falls. The consistent measurement framework allows us to make meaningful statements about how firms’ concerns with one source of risk compare to another, both at a given point in time (that is, cross-sectionally) and over time, even as the overall volume of risk discussion fluctuates.
Click to read more